Описание
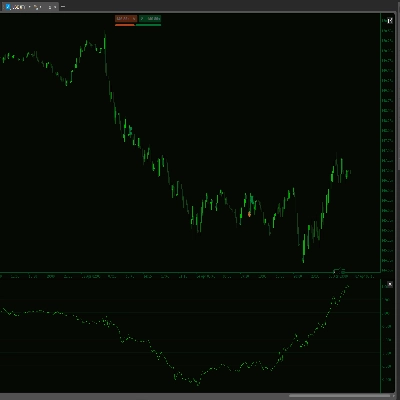
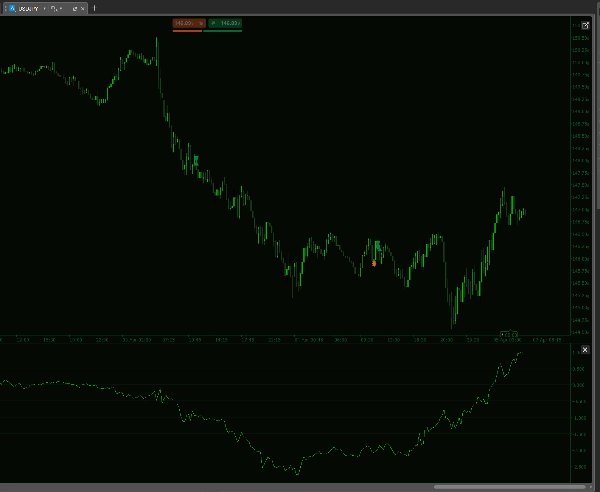
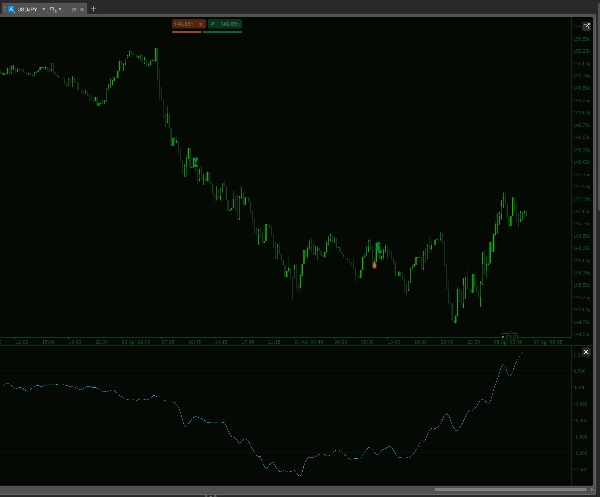
Повышайте эффективность своей торговой стратегии с помощью Индикатора Historical DXY HMA — передового инструмента cTrader, разработанного для точности и производительности. Этот продвинутый индикатор рассчитывает пользовательский индекс доллара США, объединяя взвешенные процентные изменения шести ключевых валютных пар, предоставляя вам динамичный и надежный рыночный ориентир.
Основные характеристики:
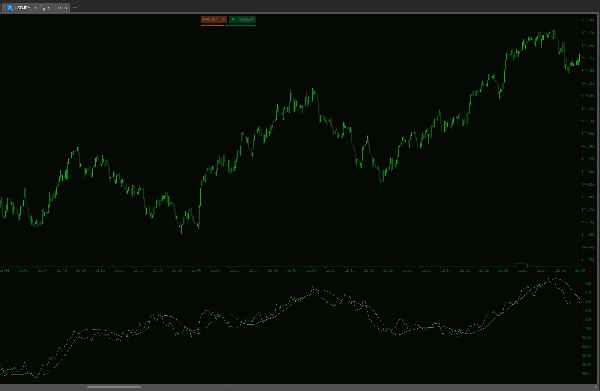
- Пользовательский расчет DXY: Интегрирует шесть основных пар с долларом США (EURUSD, USDJPY, GBPUSD, USDCAD, USDCHF, USDSEK) с настраиваемыми весами для точной настройки индекса.
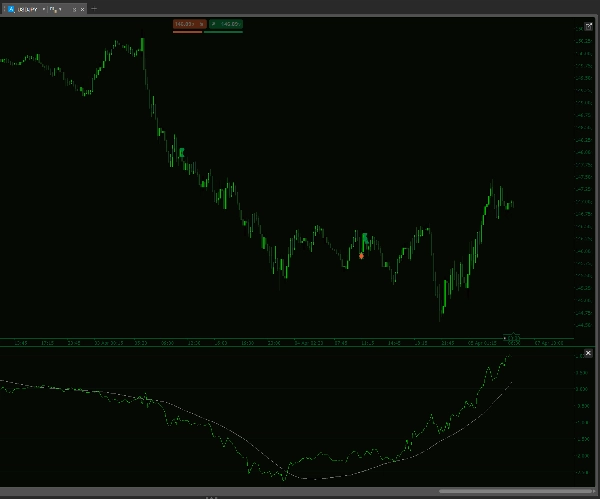
- Двойные скользящие средние Халла: Использует как короткие, так и длинные периоды скользящих средних Халла для четкого отображения рыночных трендов и импульса.
- Сглаживание наклона: Улучшает обнаружение трендов с помощью сглаженного наклона HMA, давая вам преимущество в выявлении разворотов рынка.
- Надежная обработка данных: Беспрепятственно синхронизируется с вашей платформой cTrader, обеспечивая точный анализ в реальном времени даже при работе с разными источниками данных.
- Настраиваемые параметры: Точно настраивайте количество периодов и периоды скользящих средних, чтобы идеально соответствовать вашему стилю торговли и рыночным условиям.
Разработанный с учетом потребностей современного трейдера, индикатор Historical DXY HMA упрощает сложные рыночные данные до практических инсайтов, позволяя принимать более умные и уверенные торговые решения. Испытайте новый уровень рыночного анализа!
--------------------------
Пожалуйста, ознакомьтесь с моими другими индикаторами!
https://ctrader.com/products/1181
https://ctrader.com/products/1182
https://ctrader.com/products/1180
https://ctrader.com/products/1015
https://ctrader.com/products/555
https://ctrader.com/products/553
https://ctrader.com/products/554
https://ctrader.com/products/552
https://ctrader.com/products/557
https://ctrader.com/products/845
https://ctrader.com/products/848
https://ctrader.com/products/847
https://ctrader.com/products/846
https://ctrader.com/products/551
https://ctrader.com/products/574
https://ctrader.com/products/573
https://ctrader.com/products/556
https://ctrader.com/products/558
https://ctrader.com/products/559
https://ctrader.com/products/560