


Описание
Hyper Trend PRO не просто сообщает вам, что тренд изменился. Он показывает, насколько остальная часть графика с этим согласна.
Как формируется сигнал
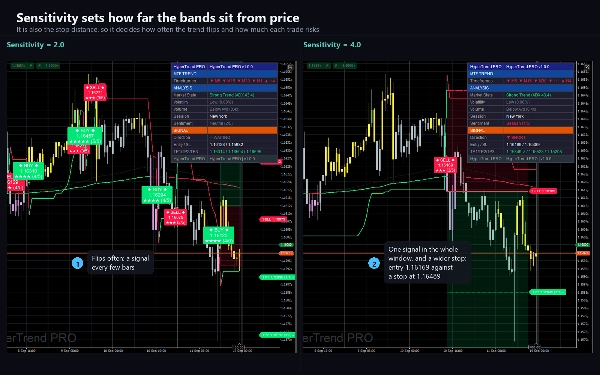
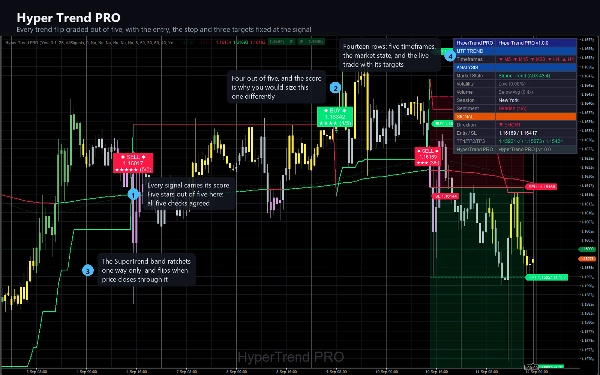
SuperTrend, построенный на основе среднего истинного диапазона, отмечает тренд. Полосы размещаются выше и ниже цены на кратное значение 25-периодного ATR, каждая полоса движется только в одном направлении, и тренд меняется, когда цена закрывается за полосой с противоположной стороны. Каждый сигнал начинается с такого изменения, и ничто другое не создает сигнал.
Затем изменение оценивается по пятибалльной шкале. Голосуют пять независимых факторов:
- гистограмма MACD, растущая или падающая по сравнению с предыдущим баром
- 150-периодная EMA по сравнению с 250-периодной EMA
- ADX выше 20, так что изменение внутри «мертвого» диапазона отмечается как один балл
- объем по сравнению с его 20-периодным средним
- наклон 55-периодной скользящей средней Халла
Оценка отображается на сигнале в виде звезд и числа из пяти, а в оповещении обозначается как Слабый, Умеренный или Сильный. Это разница между изменением, с которым согласны четыре других показателя, и тем, что стоит отдельно.
Выбор степени избирательности
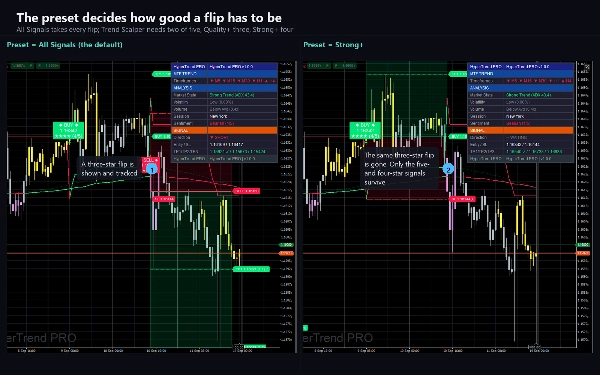
Предустановка задает минимальный балл, который должно получить изменение: All Signals принимает все, Trend Scalper требует два, Quality+ — три, а Strong+ — четыре. Шесть дополнительных фильтров могут каждый по отдельности отклонить сигнал: только трендовые рынки, только сильные оценки, только объем выше среднего, только в соответствии с облаком и контртрендовый режим, который принимает изменение только тогда, когда сглаженный RSI уже находится в противоположном экстремуме. Все они выключены, пока вы не включите их.
Торговля, которую он отображает
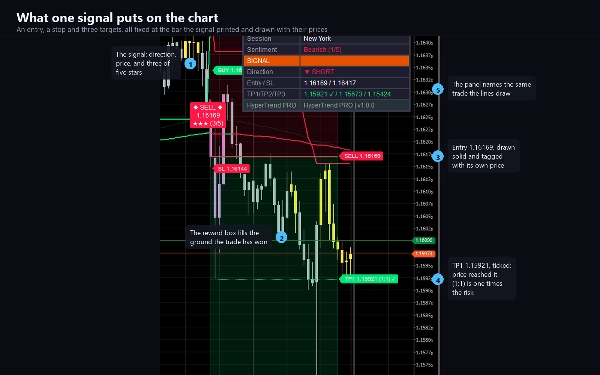
В момент появления сигнала индикатор фиксирует вход, стоп и три цели, и рисует каждую из них в виде подписанной линии с указанием цены.
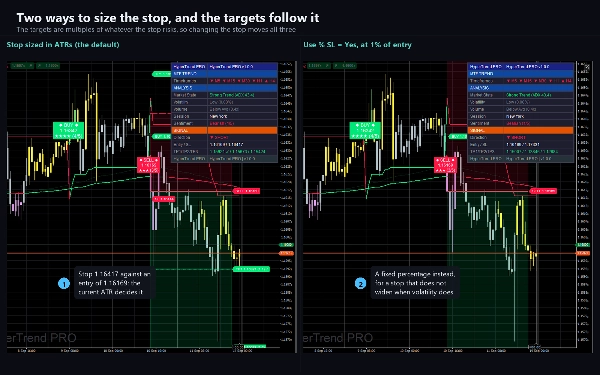
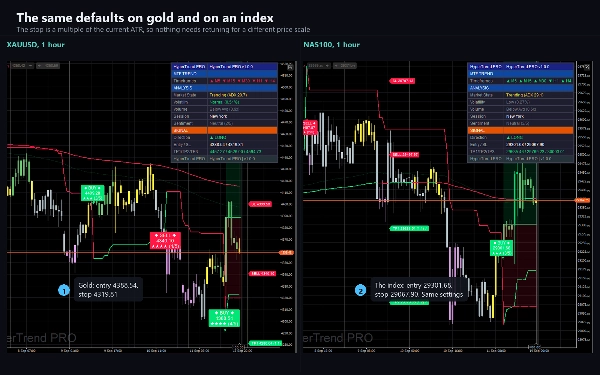
- Стоп — это кратное текущему ATR, поэтому одни и те же настройки разумно работают на пятиминутном графике и на дневном, на валютной паре и на золоте. Вместо этого доступен фиксированный процентный стоп.
- Три цели — кратные этому же риску, поэтому значения по умолчанию 1.0, 2.0 и 3.0 буквально означают один, два и три раза то, что вы рискуете.
- Каждая цель отмечается галочкой при достижении цены. Достижение третьей цели или стопа закрывает отслеживаемую сделку.
- Опциональный трейлинг-стоп на основе ATR отображается за открытой сделкой.
Что еще есть на графике
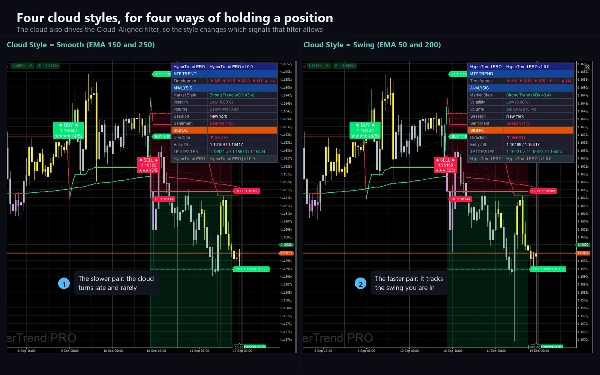
- Облако между двумя скользящими средними в четырех стилях: пара сглаженных EMA, два варианта для скальпинга и пара для свинга.
- Линия Trend Tracer с периодом 250, меняющая цвет в зависимости от цены.
- Свечи окрашены в шесть оттенков в зависимости от силы гистограммы MACD относительно волатильности, так что ослабление движения видно до его разворота. Настройка Candle Coloring переключает их на цвета тренда, оттеняет по баллу конвергенции или оставляет без изменений, если другой индикатор окрашивает свечи на том же графике.
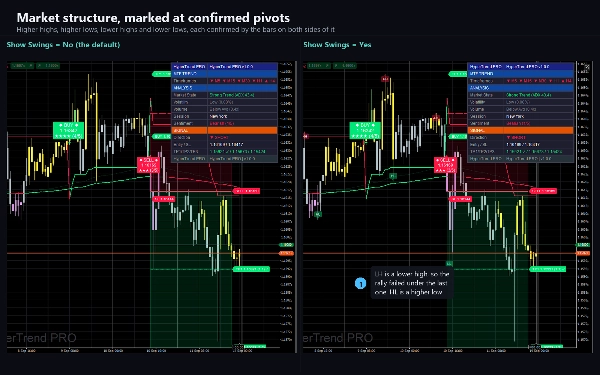
- Опциональные метки структуры рынка, отмечающие более высокие максимумы, более низкие максимумы, более высокие минимумы и более низкие минимумы.
- Опциональные маркеры откатов от осциллятора WaveTrend для повторного входа внутри тренда, а не в его начале.
Панель управления
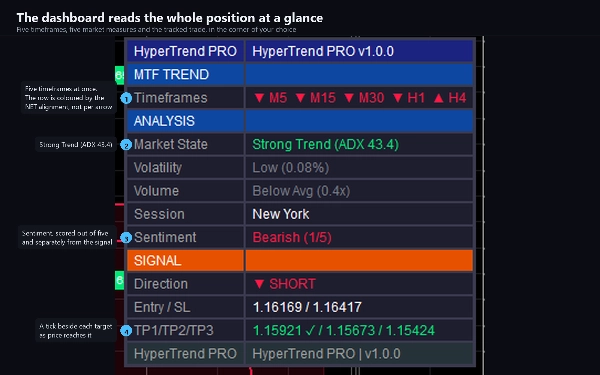
Четырнадцать строк в углу по вашему выбору. Верхний блок одновременно читает пять таймфреймов, от M5 до H4, и показывает, в какую сторону каждый из них склоняется. Ниже: состояние рынка с его ADX, волатильность в процентах от цены, объем по сравнению со средним, торговая сессия и вторая пятибалльная оценка общего настроения. Нижний блок — последний сигнал, его вход и стоп, а также три цели с галочкой рядом с каждой достигнутой.
Оповещения
Девять событий, каждое с собственным переключателем: покупка, продажа, любой сигнал, сильный сигнал, стоп, три цели и смена тренда. Каждое срабатывает один раз за закрытый бар и никогда не срабатывает для истории, поэтому подключение к длинному графику не создаёт поток старых оповещений. Доставка — журнал cTrader, опциональный звук и опциональная электронная почта через ваши собственные настройки cTrader.
Настройки
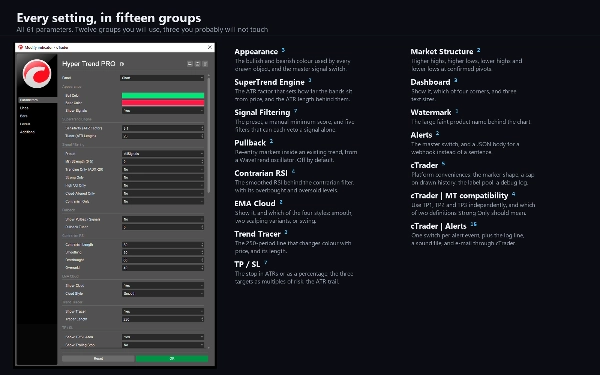
62 параметра в двенадцати группах, которые вы будете использовать, и три, к которым, вероятно, не прикоснетесь. Внешний вид, движок SuperTrend, фильтрация сигналов, откат, контртрендовый RSI, облако, трассер, риск, структура рынка, панель управления, водяной знак и оповещения. Остальное — удобства cTrader: режим окрашивания свечей, стиль маркера, ограничение объектов, журнал отладки, три переключателя совместимости и один переключатель на каждое событие оповещения.
Тип, таймфреймы и инструменты
Наложенный индикатор для анализа тренда и импульса. Его самый длинный средний период — 250 баров, поэтому он требует графика с некоторой историей; M15, H1 и H4 — это окно, для которого он был разработан, и он работает на любом таймфрейме. Проверен на основных валютных парах, золоте и индексах. Использует бары и объем: без тиковых данных, без глубины рынка, без внешних данных.
Для кого он предназначен
Трейдеры, которые хотят сигнал тренда с оценкой, а не просто да или нет, и которые хотят, чтобы стоп и цели определялись одновременно с входом, а не позже.
Пробная версия
Пробная версия — это та же сборка с одним ограничением: работает только на EURUSD, при этом принимаются суффиксы брокера, такие как EURUSD.i. Ограничений по времени нет, доступны все параметры. Полная версия добавляет все остальные символы.
Технические заметки
Сигналы не перерисовываются. Они оцениваются только на закрытых барах, поэтому маркер никогда не появляется во время свечи и не исчезает при ее закрытии. Цена такой задержки — один бар, и это сделано намеренно. Пока сделка открыта, ее уровни и подписи продолжаются вправо вместе с графиком, что сдвигает рисунок, а не уровни.
Индикатор не запрашивает права доступа. Он не открывает сетевых соединений, не читает файлы и никогда не размещает, не изменяет и не закрывает ордера. Тики на панели управления фиксируют касание цены нарисованного уровня на загруженной истории без учета спреда, комиссии или проскальзывания.
Поддержка
Вопросы задавайте через вкладку Discussion этого листинга. Пожалуйста, указывайте символ, таймфрейм, брокера, версию cTrader и скриншот с видимой панелью управления.
Торговля связана с риском. Прошлые результаты не гарантируют будущих.
Сводка
The indicator fixes entry points, ATR-based stops, and three risk-multiplied targets at the moment a signal occurs, with optional trailing stops. Multiple filters allow users to customize signal selectivity, including trend strength, volume, cloud alignment, and contrarian RSI conditions.
Additional chart features include a configurable cloud between moving averages, a 250-period Trend Tracer line, candle tinting based on MACD strength, market structure labels, and pullback markers from a WaveTrend oscillator. A dashboard displays multi-timeframe trend direction, market state, volatility, volume, session info, sentiment scores, and trade progress.
Hyper Trend PRO supports major currency pairs, gold, and indices, using bar and volume data without tick or external inputs. Alerts cover nine event types with controlled delivery. The indicator does not repaint and operates with a one-bar delay for signal confirmation. It requires no special access rights or order execution capabilities.














![Логотип продукта "Gaussian Channel [Iridio Capital]"](https://cdn.ctrader.com/image/webp/2c4f9ca9-4e9b-476d-b5a6-787c8095032b_61546)













