
present
ลงทะเบียนและรับส่วนลด $50 สำหรับการซื้อครั้งแรกของคุณ
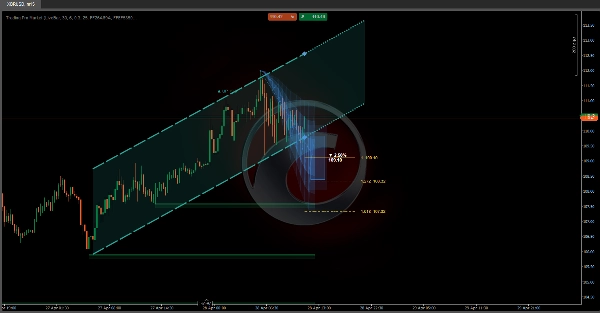
Trading product for Trading Pro Market อินดิเคเตอร์ Key Levels Channel, image 1
Trading Pro Market
อินดิเคเตอร์
เวอร์ชัน 1.0, Apr 2026
Windows, Mac
4.3
รีวิว: 3
Trading product for Trading Pro Market อินดิเคเตอร์ Key Levels Channel, image 2
Trading product for Trading Pro Market อินดิเคเตอร์ Key Levels Channel, image 3
Trading product for Trading Pro Market อินดิเคเตอร์ Key Levels Channel, image 4
Trading product for Trading Pro Market อินดิเคเตอร์ Key Levels Channel, image 5
ตั้งแต่ 03/10/2024
169
การขาย
42.53K
ติดตั้งฟรี

คำอธิบาย

📊 Trading Pro Market

https://chartshots.spotware.com/c/69f0ec41d4cfc

ช่องแนวโน้ม + การคาดการณ์ราคา + โซนแนวรับ & แนวต้านอัตโนมัติ — ทั้งหมดในตัวบ่งชี้แบบโอเวอร์เลย์เดียว

🔍 มันคืออะไร?

https://chartshots.spotware.com/c/69f0ec1fa9930

Trading Pro Market เป็นตัวบ่งชี้วิเคราะห์ทางเทคนิคขั้นสูงที่รวมสามเครื่องยนต์อิสระเข้าด้วยกันเป็นเครื่องมือเดียว: ช่องแนวโน้มพร้อมการฉายภาพล่วงหน้า, ระบบคาดการณ์ราคาที่อิงจากรูปแบบการเคลื่อนไหวในอดีต, และตัวตรวจจับโซนแนวรับ & แนวต้านอัตโนมัติ ทุกอย่างแสดงผลโดยตรงบนแผนภูมิราคา — ไม่ต้องใช้แผงแยก

📐 โมดูล 1 →ช่อง ICP🔮 โมดูล 2 → การคาดการณ์ MFP 🧲 โมดูล 3 → โซน S/R

https://chartshots.spotware.com/c/69f0ec8faa957

📐 โมดูล 1 — ช่องแนวโน้ม (ICP)

⚙️ มันตรวจจับแนวโน้มอย่างไร?

ตัวบ่งชี้จะแบ่งแท่งที่มองเห็นได้ออกเป็นบล็อกเวลา (ค่าเริ่มต้น: 30 แท่งต่อบล็อก, รวม 6 บล็อก) ภายในแต่ละบล็อกจะคำนวณจุดกึ่งกลางเชิงเรขาคณิตระหว่างราคาสูงสุดและต่ำสุดโดยใช้สเกลราคาลอการิทึม จากนั้นเชื่อมจุดกึ่งกลางเหล่านั้นข้ามบล็อกเพื่อกำหนดว่าราคากำลังมีแนวโน้มขึ้น ลง หรือเคลื่อนไหวด้านข้าง

ความชันของเส้นเชื่อมนี้จะถูกแปลงเป็นมุมที่แสดงเป็นองศา หากมุมต่ำกว่าค่าที่ตั้งไว้ (ค่าเริ่มต้น 0.3°) ตลาดจะถูกจัดประเภทว่าเป็นช่วงเคลื่อนไหวด้านข้าง หากสูงกว่าค่าดังกล่าว ตัวบ่งชี้จะกำหนดทิศทางเป็นขาขึ้นหรือขาลง

💡 ความผันผวนถูกวัดโดยใช้ตัวประมาณ Yang-Zhang — สูตรทางสถิติที่ใช้ราคาปิด เปิด สูง และต่ำเพื่อคำนวณความผันผวนที่แท้จริงของตลาด ตัวเลขนี้ช่วยปรับมุมให้เป็นมาตรฐานเพื่อให้ช่องทำงานได้อย่างสม่ำเสมอในสินทรัพย์หรือกรอบเวลาต่างๆ

🎨 มันวาดอะไรบนแผนภูมิ?

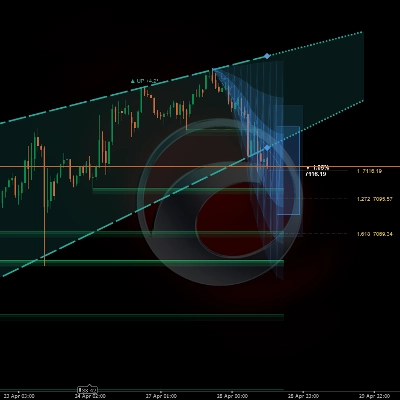
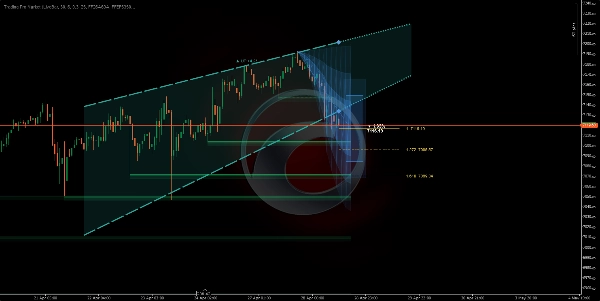
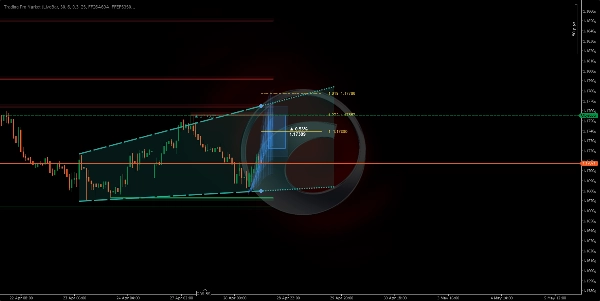
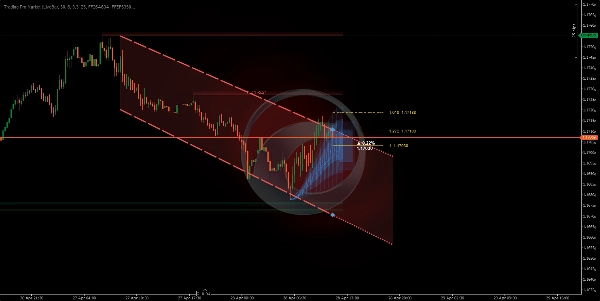
มันวาดเส้นสองเส้นที่สร้างช่อง (เพดานและพื้น) พร้อมโซนที่มีการไล่ระดับสีระหว่างเส้นเหล่านั้น ทางขวาของช่องจะขยายออกเป็นเส้นประตามความชันปัจจุบัน สีจะเปลี่ยนโดยอัตโนมัติตามทิศทาง:

🟢 สีเขียว — แนวโน้มขาขึ้น🔴 สีแดง — แนวโน้มขาลง⬜ สีเทา — ตลาดเคลื่อนไหวด้านข้าง

🔁 เครื่องสถานะ — ราคาตั้งอยู่ที่ใดภายในช่อง?

ตัวบ่งชี้ติดตามตำแหน่งราคาปิดแบบเรียลไทม์เทียบกับขอบเขตของช่องและจัดประเภทสถานการณ์เป็นห้าสถานะที่แตกต่างกัน:

🟦 ภายใน→⚡ เบรกเอาต์→📏 ระยะห่าง→↩️ ทดสอบซ้ำ→✅ ยืนยัน


แต่ละสถานะจะถูกอธิบายด้วยข้อความธรรมดาบนแผงข้อมูลของแผนภูมิ พร้อมกับระยะห่างเป็นเปอร์เซ็นต์ถึงเพดานหรือพื้นของช่องในแต่ละช่วงเวลา

🔮 โมดูล 2 — การคาดการณ์การเคลื่อนไหว (MFP)

⚙️ มันสร้างการคาดการณ์อย่างไร?

เครื่องยนต์ตรวจจับจุดเปลี่ยนราคาที่สำคัญ (จุดสูงและต่ำในท้องถิ่น) โดยดูย้อนหลังจำนวนแท่งที่ตั้งค่าได้ แต่ละจุดเปลี่ยนที่ยืนยันแล้วจะบันทึกข้อมูลสองจุด: เปอร์เซ็นต์ของการเคลื่อนไหวราคาที่เสร็จสมบูรณ์และจำนวนแท่งที่ใช้ เก็บการเคลื่อนไหวในอดีตได้สูงสุด 20 ครั้ง และคำนวณการเคลื่อนไหวถัดไปที่คาดหวังโดยใช้หนึ่งในสามวิธี:

⚖️ ถ่วงน้ำหนัก — การเคลื่อนไหวล่าสุดมีน้ำหนักมากกว่า➕ ค่าเฉลี่ยง่าย — ทุกการเคลื่อนไหวมีน้ำหนักเท่ากัน📊 มัธยฐาน — กรองค่าผิดปกติออก

🎨 มันวาดอะไรบนแผนภูมิ?

สามองค์ประกอบภาพที่เลือกได้จะถูกฉายไปข้างหน้าตามจุดเริ่มต้นของจุดเปลี่ยนปัจจุบัน:

1

🔵 โซนฉายภาพ: สามชั้นที่มีความทึบแสงลดลงซึ่งแสดงช่วงที่น่าจะเป็นไปได้ของการเคลื่อนไหว กรวยที่กว้างขึ้นหมายถึงความไม่แน่นอนที่มากขึ้นตามความแปรปรวนในอดีต

2

🎯 กล่องเป้าหมาย: สี่เหลี่ยมผืนผ้าที่วางไว้ที่ราคาปลายทางที่ประมาณไว้ พร้อมกับเปอร์เซ็นต์การเคลื่อนไหวที่คาดหวังและระดับราคาที่ระบุอย่างชัดเจนในข้อความ

3

📏 ระดับฟีโบนัชชี: เส้นแนวนอนที่ฉายจากจุดเริ่มต้นไปยังปลายทางโดยใช้สัดส่วนที่ตั้งค่าได้ (ค่าเริ่มต้น: 1.0, 1.272, และ 1.618).

⚠️ การคาดการณ์ไม่ได้ทำนายอนาคต มันเป็นค่าเฉลี่ยทางสถิติของการเคลื่อนไหวที่คล้ายกันในอดีต คุณค่าของมันอยู่ที่การตั้งความคาดหวังที่สมจริงสำหรับขนาดและระยะเวลา — ไม่ใช่สัญญาณเข้าออกแบบอิสระ

🧲 โมดูล 3 — โซนแนวรับ & แนวต้าน

⚙️ มันตรวจจับโซนอย่างไร?

ทุกครั้งที่จุดเปลี่ยนได้รับการยืนยัน ตัวบ่งชี้จะวาดโซนแนวนอนโดยใช้ ATR (ช่วงจริงเฉลี่ย) เพื่อกำหนดความหนาของโซน โซนแนวต้านจะวาดด้วยสีแดง โซนแนวรับด้วยสีเขียว — ทั้งสองมีสองชั้นความทึบแสงเพื่อสร้างความลึกและความชัดเจนทางสายตา

โซนทำงานแบบไดนามิก: หากราคาปิดอยู่ฝั่งตรงข้ามของโซน จะถูกทำเครื่องหมายว่า "ถูกทำลาย" — เปลี่ยนเป็นเส้นประที่มีความทึบแสงลดลง โซนจะหายไปโดยอัตโนมัติหลังจากจำนวนแท่งที่ตั้งค่าใน "อายุโซน"

🚀 วิธีใช้

1

ยืนยันแนวโน้ม: ตรวจสอบสีและทิศทางของช่อง มุมองศาบอกความแรงของแนวโน้ม — มุมที่ชันกว่าหมายถึงโมเมนตัมที่มากขึ้น

2

อ่านสถานะราคา: แผงข้อมูลบนแผนภูมิอธิบายว่าราคาอยู่ภายใน กำลังเบรกเอาต์ หรือทดสอบซ้ำขอบเขตของช่องแบบเรียลไทม์

3

ประเมินการฉายภาพ: กรวยและกล่องเป้าหมายให้ข้อมูลอ้างอิงว่าราคาอาจเคลื่อนไปที่ไหนและไกลแค่ไหน โดยอิงจากห้องสมุดรูปแบบในอดีตที่สร้างขึ้นในช่วงเซสชัน

4

เคารพโซน: กล่อง S/R ที่ไม่ถูกทำลายแสดงระดับราคาที่ตลาดเคยตอบสนอง โซนที่ยังไม่ถูกเจาะมีความสำคัญมากกว่าโซนที่ถูกเจาะแล้ว

🖥️ ความเข้ากันได้ & ข้อกำหนด

✅ cTrader✅ cAlgo API✅ สินทรัพย์ใดก็ได้✅ กรอบเวลาใดก็ได้✅ โอเวอร์เลย์ราคา

ไม่ต้องการการเข้าถึงอินเทอร์เน็ตหรือสิทธิพิเศษพิเศษ การคำนวณทั้งหมดทำในเครื่องโดยใช้ข้อมูลราคาที่มีอยู่ในแพลตฟอร์มแล้ว

⏱️ เพื่อผลลัพธ์ที่ดีที่สุด ใช้กับกรอบเวลาตั้งแต่ 15 นาทีขึ้นไป ในกรอบเวลาต่ำมาก (1–5 นาที) เสียงรบกวนของตลาดอาจสร้างจุดเปลี่ยนที่มีความน่าเชื่อถือต่ำ ลดคุณภาพของทั้งโซน S/R และการคาดการณ์

สรุป

สรุปโดย AI
Trading Pro Market is a comprehensive technical analysis indicator designed for use on cTrader and cAlgo platforms, compatible with any asset and timeframe (best on 15 minutes or higher). It integrates three core modules into a single price chart overlay:

1. Trend Channel (ICP): Divides visible bars into time blocks, calculates geometric midpoints on a logarithmic price scale, and connects these to identify trend direction (bullish, bearish, or ranging) with a slope angle. It visualizes the trend channel with color-coded lines and shaded zones, projecting the channel forward. The indicator tracks the price’s position relative to the channel, classifying it into five states (Inside, Breakout, Distanced, Retest, Confirmed) displayed on an info panel.

2. Movement Forecast (MFP): Detects significant price pivots and analyzes up to 20 historical moves to statistically estimate the next price movement using weighted, average, or median methods. It projects a probabilistic range (Projection Zone), a target price box with expected move percentage, and Fibonacci levels for reference.

3. Support & Resistance Zones: Automatically identifies horizontal support and resistance zones based on confirmed pivots and ATR for zone thickness. Zones are color-coded (green for support, red for resistance), dynamically update when broken, and expire after a configurable lifespan.

All calculations are performed locally without internet access or special permissions. The tool provides visual signals for trend strength, breakout, and key level interactions directly on the price chart.
โปรไฟล์อินดิเคเตอร์
หมวดหมู่อินดิเคเตอร์
โครงสร้างตลาด (SMC)
ประเภทเอาต์พุต
การแสดงเป็นภาพ
สัญญาณ
ข้อกำหนดด้านข้อมูล
แท่งเท่านั้น
สัญญาณที่รองรับ
Breakout
ความแข็งแกร่งของแนวโน้ม
เบรก Level ที่ระบุ
แตะ Level ที่ระบุ

รีวิวจากลูกค้า

4.3
รีวิว: 3
5
33 %
4
67 %
3
0 %
2
0 %
1
0 %
รีวิวจากลูกค้า
May 13, 2026
Two timeframes give more context. It helps the review while staying in the background.
May 11, 2026
1.5R target is the line to watch. The trade idea gets a pause before execution.
May 3, 2026
messy ideas are easier to pass on, but false confidence is the weak spot.

การสนทนา

คำถามที่พบบ่อย

Key Levels
Channel
Support & Resistance
ผลิตภัณฑ์ที่มีให้บริการผ่าน cTrader Store รวมถึงบอทการเทรด อินดิเคเตอร์ และปลั๊กอิน มีให้บริการโดยนักพัฒนาบุคคลที่สามและมีไว้เพื่อวัตถุประสงค์ในการเข้าถึงข้อมูลและทางเทคนิคเท่านั้น cTrader Store ไม่ใช่โบรกเกอร์และไม่ได้ให้คำแนะนำการลงทุน คำแนะนำส่วนบุคคล หรือการรับประกันผลการดำเนินงานในอนาคต

เพิ่มเติมจากผู้เขียนคนนี้

"ZigZag" โลโก้
เรตติ้งสูง
4.3
(6)
ฟรี
อินดิเคเตอร์
ATR
RSI
+7
ZigZag filters noise, spots trends, patterns, pivots, aiding analysis, trade management, and confirmations. 📉📈
"Order Block" โลโก้
ยอดนิยม
4.8
(5)
$19
อินดิเคเตอร์
ATR
RSI
+7
Identify bullish and bearish Order Blocks to spot key support/resistance levels and potential trend reversals! 📈🔄
"Volume POC Heatmap" โลโก้
เรตติ้งสูง
5.0
(4)
ฟรี
อินดิเคเตอร์
ATR
RSI
+7
📊 Shows volume by price levels, highlights POC, and key zones. Identifies dynamic support/resistance and imbalances.
"BOS & CHOCH" โลโก้
ยอดนิยม
5.0
(2)
$19
/
$25
อินดิเคเตอร์
ATR
RSI
+6
Market structural patterns , specifically the concepts of Change of Character (ChoCH) 🔄 and Break of Structure (BoS) 💥
"Auto-Trend Channel" โลโก้
เรตติ้งสูง
4.4
(5)
ฟรี
อินดิเคเตอร์
ATR
RSI
+6
Adaptive trend channel using linear regression and Pearson correlation for dynamic support, resistance, and trends.
อินดิเคเตอร์
RSI
Breakout
+1
"Identify key market zones and visualize support/resistance from multiple timeframes on a single chart.
"Fair Value Gap Sessions" โลโก้
เรตติ้งสูง
5.0
(4)
ฟรี
อินดิเคเตอร์
ATR
RSI
+7
identify and highlight temporary market inefficiencies known as "fair value gaps" 🚨 within specific trading Sessions.
"Supertrend" โลโก้
ยอดนิยม
4.3
(3)
$19
อินดิเคเตอร์
ATR
RSI
+6
💹 Define a price channel 📈 and determine trend direction (bullish 🟢 or bearish 🔴).
อินดิเคเตอร์
ATR
RSI
+6
📊Zones Supply & Demand: Identifies key price levels with high volume concentration, marking Supply/Demand Zones & Marke
อินดิเคเตอร์
RSI
BTCUSD
+5
Identify market structure effortlessly with swing highs, lows, CHoCH, and BOS levels for smart trading decisions! 📊🔍"
ปลั๊กอินหลายแพลตฟอร์ม
Economic Calendar
Displays live economic events directly inside your cTrader charts.
อินดิเคเตอร์
Advanced price action tool that combines multiple technical analysis concepts

นอกจากนี้คุณยังอาจชอบ

อินดิเคเตอร์
Plot higher-timeframe Bollinger Bands for clearer structure, pullback zones, and breakout signals—without switching char
อินดิเคเตอร์
Key Levels
Support & Resistance
Clean psychological round-number grid with native pip and point auto-scaling across Forex, Gold, Indices, and Crypto.
อินดิเคเตอร์
AI
ATR
+26
Session Volume Profile + Composite. POC/VAH/VAL, Focus/Solo. Fast, clean, no ghosts, live-ready.
"Trend Sniper" โลโก้
ยอดนิยม
4.3
(3)
$19
/
$29
อินดิเคเตอร์
Prop
Forex
+9
Trend Sniper — session-based tool highlighting live session ranges and adaptive Custom line.
อินดิเคเตอร์
BOS
CHOCH
+5
BOS/CHoCH signals confirmed by liquidity sweep + FVG confluence, with a live conviction score.
อินดิเคเตอร์
AI
ATR
+25
On-chart draggable panel to show/hide Positions & Pending Orders with fixed warning banner and inline alerts per symbol.
"UT Bot Alerts Nova" โลโก้
ยอดนิยม
4.8
(6)
$19
อินดิเคเตอร์
ATR
Forex
+6
UT Bot Alerts Nova: Advanced trend-following indicator using ATR for signals. Precise entries/exits.
อินดิเคเตอร์
ATR
RSI
+24
Daily moving averages, simplified. Displays 3 daily moving averages on lower timeframes with selectable MA types.
"macdZR" โลโก้
เรตติ้งสูง
4.6
(5)
$19
อินดิเคเตอร์
MACD
Forex
+5
MACD ZERO LAG. Get faster signals, earlier trend detection, and eliminate the delay of traditional moving averages
อินดิเคเตอร์
ATR
Channel
Reversal Trap Probability Bands plots a dynamic volatility envelope around price & automatically detects "trap" reversal
อินดิเคเตอร์
BOS
Volume
+5
20/40/60-day IPDA lookback ranges, Premium/Discount/Equilibrium zones, and quarterly shift alerts — anchored to true dai
อินดิเคเตอร์
AI
Grid
+9
Pivot Point MultiTimeFrame with Order Block
"Squeeze Pro Momentum" โลโก้
เรตติ้งสูง
4.0
(4)
$19
/
$29
อินดิเคเตอร์
ATR
Volume
+4
This allows traders to see not just the trend, but whether the momentum itself is overextended.
อินดิเคเตอร์
BOS
MSS
+5
One indicator, full ICT/SMC picture — structure, OBs, FVGs, liquidity, Premium/Discount — with graded PRIME/SETUP signal
"VegaXLR - Fibonacci Alerts" โลโก้
ยอดนิยม
4.5
(4)
$20
อินดิเคเตอร์
Forex
Alerts you when price touches Fibonacci levels. Stay organized and trade efficiently!
"ORB v1" โลโก้
ยอดนิยม
5.0
(3)
$19
อินดิเคเตอร์
Breakout
Opening Range Breakout (ORB) - Visual Edition
"[Stellar Strategies] VBO" โลโก้
เรตติ้งสูง
4.8
(5)
$19
/
$29
อินดิเคเตอร์
Forex
BTCUSD
+11
Next-gen Volume Oscillator using Hyperbolic Tangent math. No repainting. Includes arrows, alerts, and overlay mode 🎯
อินดิเคเตอร์
Volume
Imbalance
+1
Volume profile indicator that auto-detects the latest trendline. Shows POC, Value Area (VAH/VAL), and High Volume Nodes

ราคา

ตั้งแต่ 03/10/2024
169
การขาย
42.53K
ติดตั้งฟรี




























