present
Registrieren Sie sich und erhalten Sie $50 Rabatt auf Ihren ersten Kauf
Trading product for Market Structure Trend Targets Indikator Supertrend Key Levels, image 1
Market Structure Trend Targets
Indikator
Version 1.0, May 2026
Windows, Mac
Trading product for Market Structure Trend Targets Indikator Supertrend Key Levels, image 2
Trading product for Market Structure Trend Targets Indikator Supertrend Key Levels, image 3
Trading product for Market Structure Trend Targets Indikator Supertrend Key Levels, image 4
Trading product for Market Structure Trend Targets Indikator Supertrend Key Levels, image 5
Trading product for Market Structure Trend Targets Indikator Supertrend Key Levels, image 6
Trading product for Market Structure Trend Targets Indikator Supertrend Key Levels, image 7
Trading product for Market Structure Trend Targets Indikator Supertrend Key Levels, image 8
38
Verkäufe
2.51K
Kostenlose Installationen

Beschreibung

The Market Structure Trend Targets ist ein leistungsstarker Handelsindikator, der Tradern eine klare, strukturierte und datenbasierte Sicht auf Marktimpulse, Ausbrüche und wichtige Preisreaktionszonen bietet. Basierend auf den Prinzipien der intelligenten Marktstrukturanalyse hilft er nicht nur, die Trendrichtung zu erkennen, sondern auch präzise AusbruchsniveausTrenderschöpfung und potenzielle Umkehrzonen — alles mit visueller Klarheit und traderfreundlichen Metriken.

Hauptmerkmale

Ausbruchspunkte mit nummerierten Markierungen

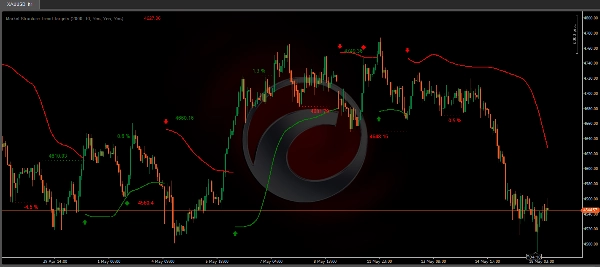
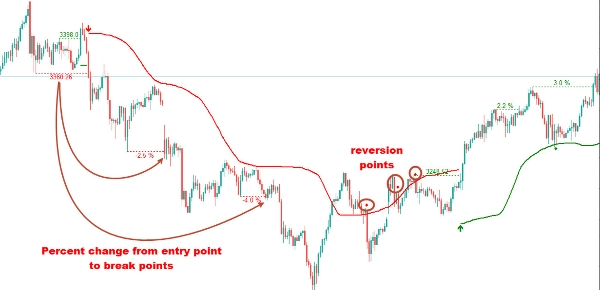
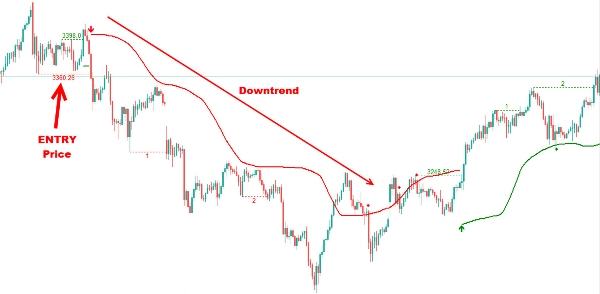
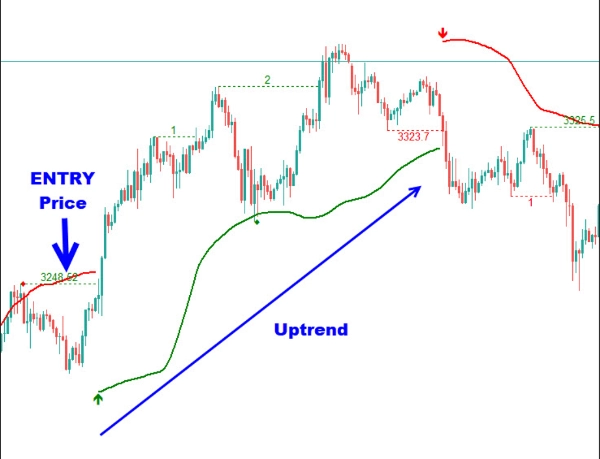
Verfolgen Sie bedeutende strukturelle Ausbrüche mit aufeinanderfolgenden nummerierten Markierungen, die Ihnen helfen, die Entwicklung der Kursbewegung visuell nachzuvollziehen. Egal, ob sich der Markt in einem Auf- oder Abwärtstrend befindet, jeder Ausbruchspunkt wird protokolliert und zur einfachen Nachverfolgung und Bestätigung struktureller Veränderungen angezeigt. Der erste Ausbruch (Null-Ausbruch) ist mit dem Einstiegspreis und einem Pfeilsymbol markiert, während nachfolgende Ausbrüche im Trend fortlaufend nummeriert werden (1, 2, 3…), um die Fortsetzung des Trends anzuzeigen.

Prozentuale Veränderung

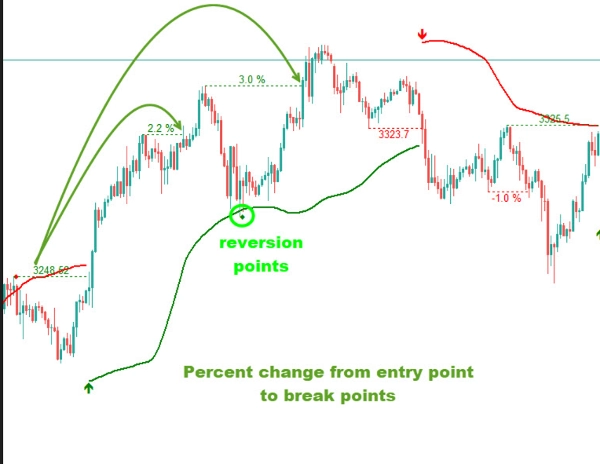
Sehen Sie genau, wie viel sich der Preis seit jedem Ausbruchspunkt mit Prozentänderungsbeschriftungen bewegt hat. Dies gibt Ihnen ein Echtzeitgefühl für Marktstärke, Volatilität und potenzielle Erschöpfung und hilft Ihnen einzuschätzen, ob eine Bewegung noch Kraft hat oder sich ihrem Ende nähert.

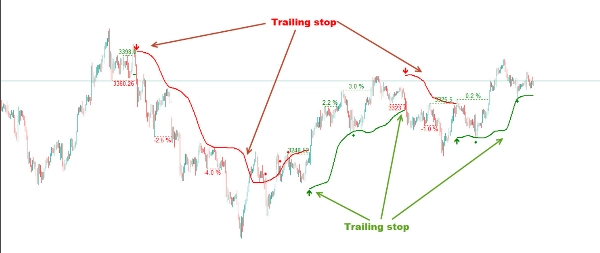
Trailing Stop-Loss-Niveaus

Dieser Indikator berechnet automatisch dynamische Stop-Loss-Niveaus basierend auf jüngsten strukturellen Wendepunkten, Ausbruchbestätigung und Volatilität. Diese intelligenten Niveaus passen sich an, wenn sich der Preis bewegt, und helfen Tradern, Trends zu verfolgen und gleichzeitig das Risiko präzise zu steuern. Wenn der Preis das Stop-Loss-Niveau durchbricht, zeigt der Indikator Punkte an, die ein mögliches Ende oder eine Umkehr des Trends signalisieren.

Umkehrsignale

Der Indikator erkennt potenzielle Mittelwertumkehrpunkte mit Diamantsymbolen. In einem Aufwärtstrend, wenn der Preis unter das Stop-Loss fällt und dann wieder darüber steigt, wird ein Diamant gesetzt, der auf eine mögliche Mittelwertumkehr hinweist. Ebenso zeigt in einem Abwärtstrend ein Anstieg über das Stop-Loss und anschließender Rückfall darunter eine Umkehrmöglichkeit an.

 Anwendungsfälle:

  • Trendfolgestrategien basierend auf Marktstruktur
  • Bestätigung für Smart Money Concepts (SMC) Setups
  • Dynamische Ziel- und Stop-Setzung für Swing- und Intraday-Trader
  • Visuelles Trade-Journaling und Ausbruchverfolgung

Benutzereingaben:

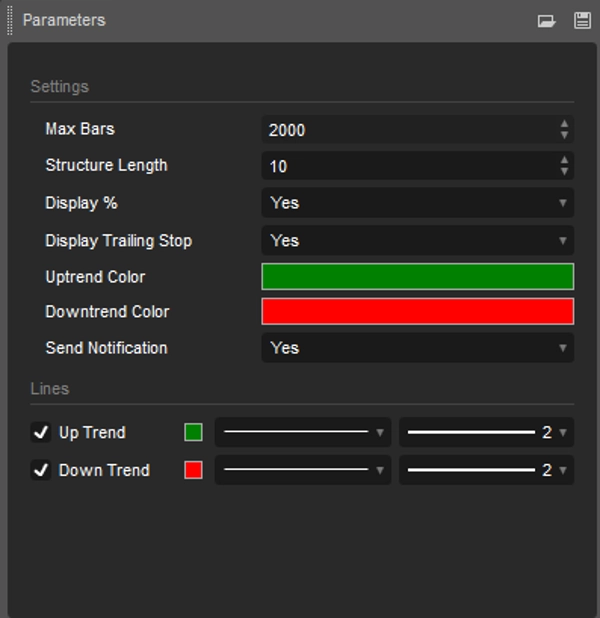
  • Länge: Definiert die Anzahl der Kerzen, die verwendet werden, um Pivot-Hochs und -Tiefs für Trendausbrüche zu identifizieren.
  • Anzeige Prozentual: Option zum Umschalten zwischen der Anzeige fortlaufender Ausbruchsnummern oder der prozentualen Veränderung seit dem ersten Ausbruch.
  • Anzeige Trailing Stop: Zeigt den Trailing Stop im Chart an
  • Farben für Auf- und Abwärtstrend: Ermöglicht die Anpassung der Farbzonen für Auf- und Abwärtstrends entsprechend individueller Chartpräferenzen.
  • Alarm/Benachrichtigung: Ermöglicht das Senden von Alarmen oder Benachrichtigungen an das Mobilgerät

The Market Structure Trend Targets verwandelt Kursbewegungen in umsetzbare, leicht verständliche Erkenntnisse — und verschafft Tradern so einen taktischen Vorteil mit Klarheit, Kontrolle und Vertrauen.

Zusammenfassung

KI-Zusammenfassung
Market Structure Trend Targets is a trading indicator that provides a structured analysis of market momentum, breakouts, and key price reaction zones based on market structure principles. It visually identifies trend direction, precise breakout levels, trend exhaustion points, and potential reversal zones.

Key features include:
- Sequential numbered markers for breakout points, starting with an initial breakout marked by an entry price and arrow, followed by numbered continuation breakouts.
- Percentage change labels showing price movement from each breakout point to assess market strength and potential exhaustion.
- Dynamic trailing stop loss levels calculated from recent pivots and volatility, adjusting as price moves to help manage risk and trail trends.
- Reversion signals marked by diamond icons indicating possible mean reversion points when price crosses trailing stops in either trend direction.

User inputs allow customization of pivot length, display options for breakout numbers or percentage changes, trailing stop visibility, color settings for uptrends and downtrends, and alert notifications.

Use cases include trend-following strategies, confirmation for Smart Money Concepts setups, dynamic target and stop placement for swing and intraday trading, and visual trade journaling with breakout tracking. The indicator outputs visual signals on price charts to support decision-making based on market structure shifts.
Indikatorprofil
Indikatorkategorie
Muster
Ausgabetyp
Visualisierung
Datenanforderungen
Nur Balken
Unterstützte Signale
Ausbruch

Kundenbewertungen

0.0
Bewertungen: 0
Kundenbewertungen
Bisher gibt es keine Bewertungen für dieses Produkt. Haben Sie es schon ausprobiert? Dann können Sie die erste Person sein, die andere darüber informiert!

Diskussion

Häufig gestellte Fragen (FAQ)

Supertrend
Key Levels
MSS
Market Structure
Über den cTrader Store verfügbare Produkte, einschließlich Handelsbots, Indikatoren und Plugins, werden von externen Entwicklern bereitgestellt und nur zu Informations- und technischen Zugriffszwecken verfügbar gemacht. cTrader Store ist kein Broker und erbringt keine Anlageberatung, persönlichen Empfehlungen oder eine Garantie für zukünftige Performance.

Mehr von diesem Autor

Indikator
SMC
Forex
+7
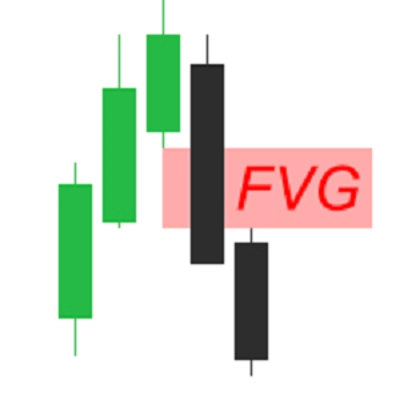
The Fair Value Gap (FVG) Indicator identifies inefficiencies in price action where an imbalance occurs due to aggressive
Indikator
SMC
Forex
+7
Simple Smart Money Concepts (SMC)
Indikator
Forex
BTCUSD
+6
The Market Sessions indicator is a popular tool for visually representing global trading sessions on a price chart.
Indikator
SMC
Forex
+5
Pure Price Action ICT Tools
Indikator
MACD
Forex
+5
MACD Indicator with Histogram that plots Colors Based on Direction Above and Below the Zero Line.
Indikator
Forex
BTCUSD
+6
All-In-One solution for ICT's FVG IFVG ORDERBLOCK in advanced mode.
Indikator
Forex
BTCUSD
+4
The Linear Regression Oscillator (LRO) is a technical indicator based on linear regression analysis.
Indikator
Forex
BTCUSD
+5
Simple ICT Concepts
Indikator
Forex
BTCUSD
+5
This indicator displays the OrderBlocks of the current and higher timeframe, made by ICT's student.
Indikator
BOS
MSS
+3
Orderblocks with Multi-Timeframe.
Indikator
Forex
BTCUSD
+4
This indicator is designed to perform multiple non-linear regression analysis using four independent variables.
Indikator
ATR
BOS
+3
Fair Value Gaps with Multi-Timeframe.

Das könnte Sie auch noch interessieren

Indikator
ZigZag Smart Alert for cTrader Description: ZigZag Smart Alert is a next-generation swing indicator for cTrader, designe
Indikator
Prop
Forex
+11
Customize your Moving Average! Choose any timeframe and price source for precision and flexibility in your analysis.
Indikator
AI
ATR
+27
Supertrend Indicator
Indikator
EMA
Supertrend
+4
Dynamic dual MA cloud indicator. Identifies trends, crossovers, and pullback entries in real time for any asset.
Indikator
AI
ATR
+26
Liquidity Cluster Order automatically detects and draws accumulation zones & distribution zones
Indikator
MACD
Prop
+14
Customize the MACD! Choose colors, get real-time tick updates, and see crossover points for enhanced trading precision.
Indikator
Triangle
Double Top
+5
Know which liquidity sweeps are real. Auto-tracks EQH/EQL and confirms genuine reversals, not just broken levels.
Indikator
BOS
Volume
+5
20/40/60-day IPDA lookback ranges, Premium/Discount/Equilibrium zones, and quarterly shift alerts — anchored to true dai
Indikator
BOS
Volume
+5
The Volume Delta Indicator using Institutional Level 2 DOM Data, The Edge Institutions Pay Millions For, now on cTrader
Indikator
Prop
Forex
+4
Pivot Points Standard — All-in-One Multi-Timeframe Pivot Indicator for cTrader
Indikator
RSI
Signal
+2
Dynamic circles visualize price's volatility position. Like RSI for market overextension & stretch. Quantify context.
Indikator
Fisher Transform with smoothing. Spot reversals and cycles with precision. Great for any market, any timeframe.
Indikator
BOS
EMA
+5
Directional volume heatmap: see if a price zone was built on buying or selling, not just how much.
Indikator
Key Levels
Liquidity Sweep
Professional Opening Range Breakout, Initial Balance, False breakout Detection
Indikator
Prop
Forex
+12
Identify and trade breakouts with Consolidation Zones! Visualize price consolidation areas for trading opportunities.
Indikator
SMC
Prop
+15
Automatic Elliott Wave Detection with Professional Filters
Indikator
RSI
Key Levels
+3
MARCs Multi-timeframe market dashboard with trend rows, RSI context, sessions, presets and optional chart levels.
Indikator
Forex
Crypto
+3
Detect powerful 2-candle reversal patterns at key highs/lows. Boost entries with real-time alerts and visual signals.

Preis

38
Verkäufe
2.51K
Kostenlose Installationen