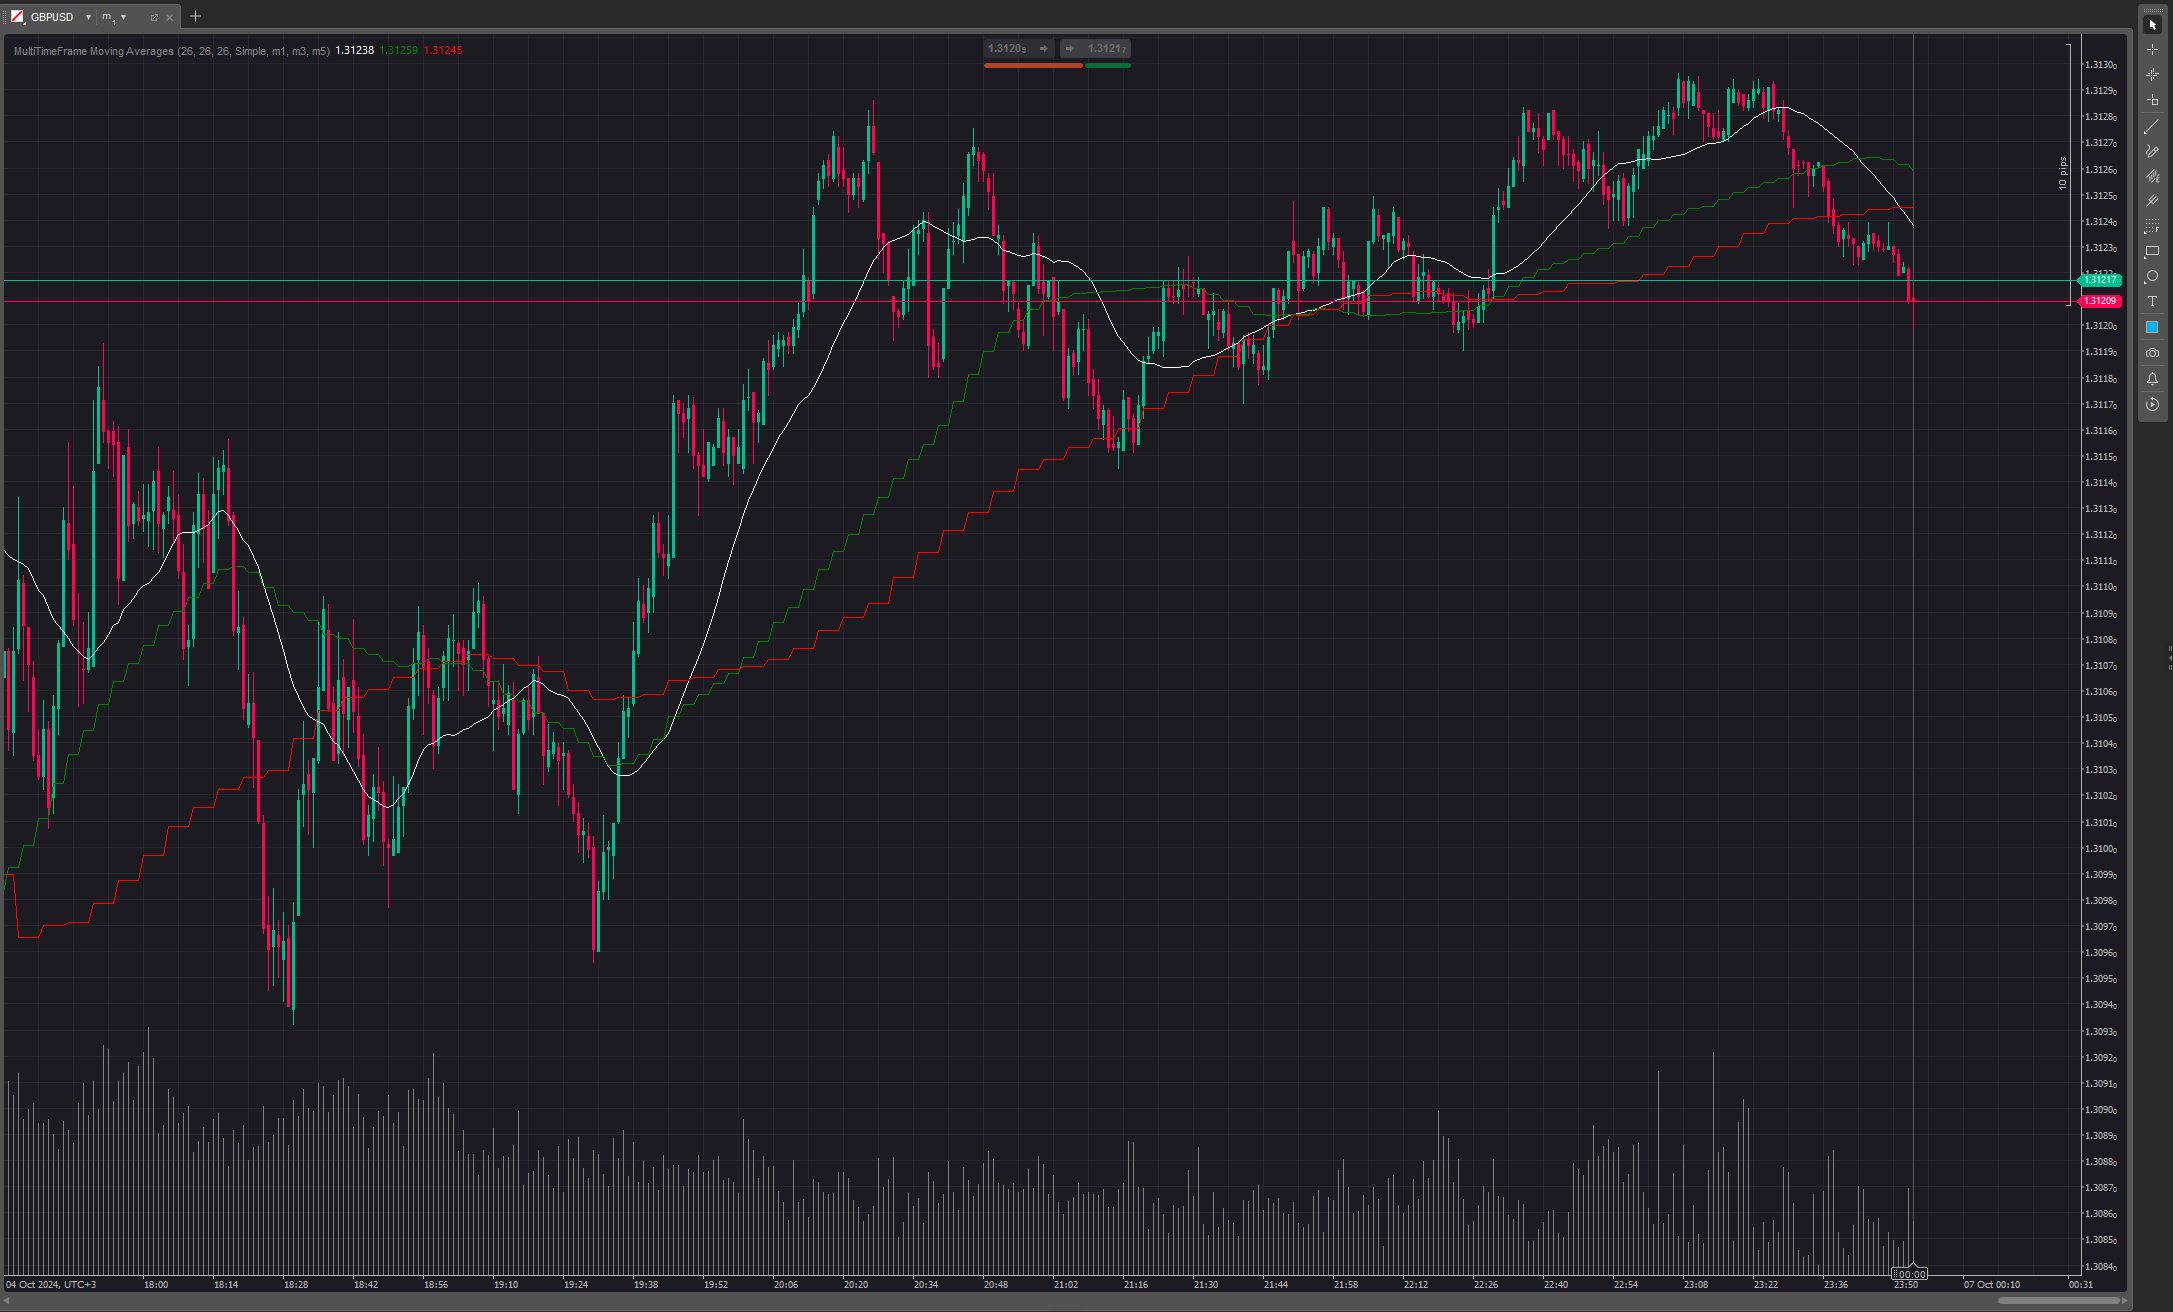
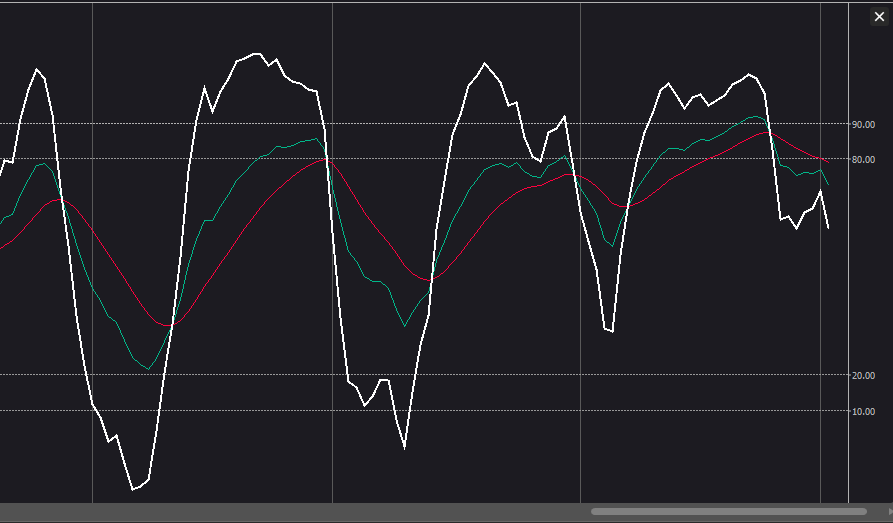
MultiTimeFrame Moving Averages
03/09/2025
1022
Desktop
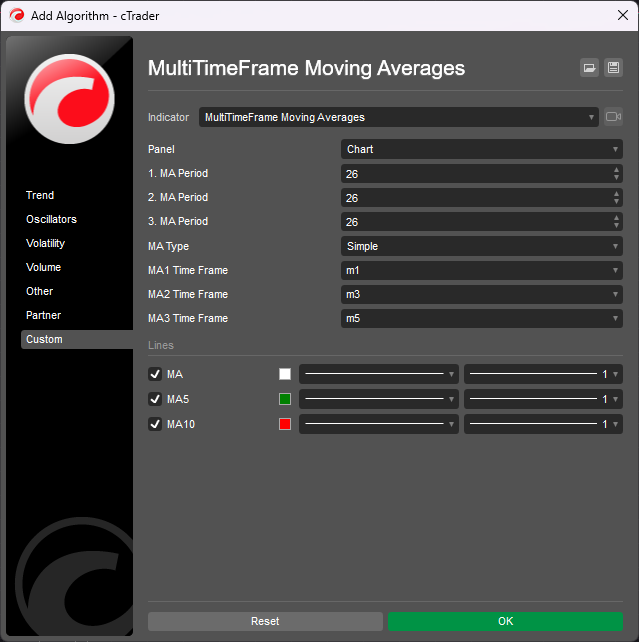

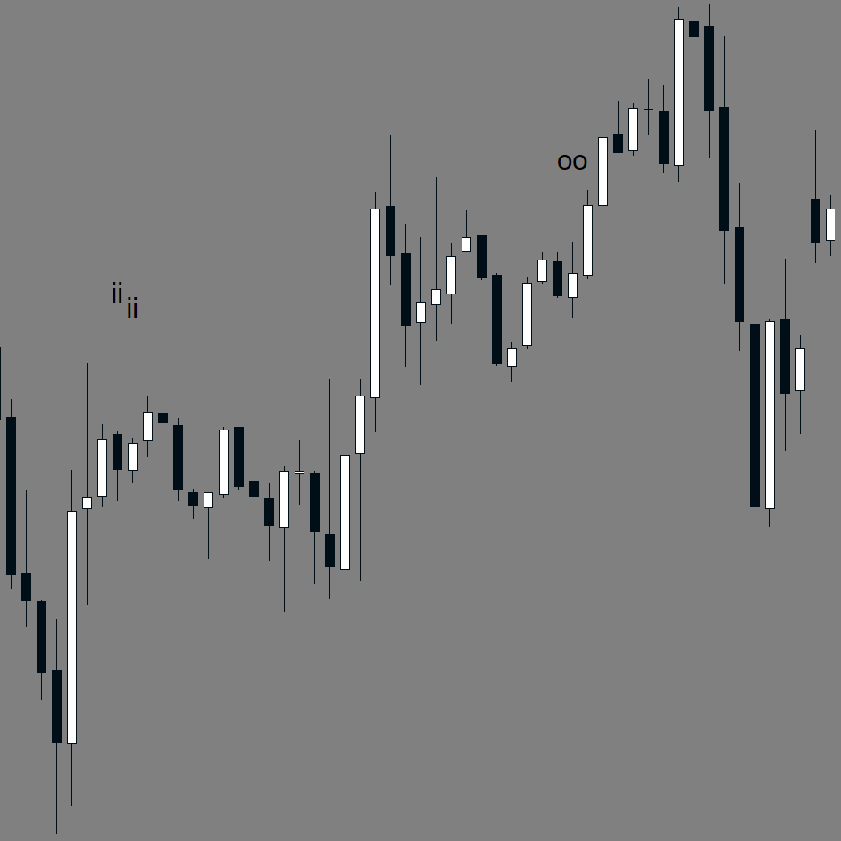
These 3 Moving Averages can run on different timeframes and different periods. For example 1 can be 9 period EMA in 1 minute, 2. can be 21 periods WMA in 5 minutes and 3. can be 100 periods SMA in 1 hour.
More from this author


You may also like


.jpg)

.png)