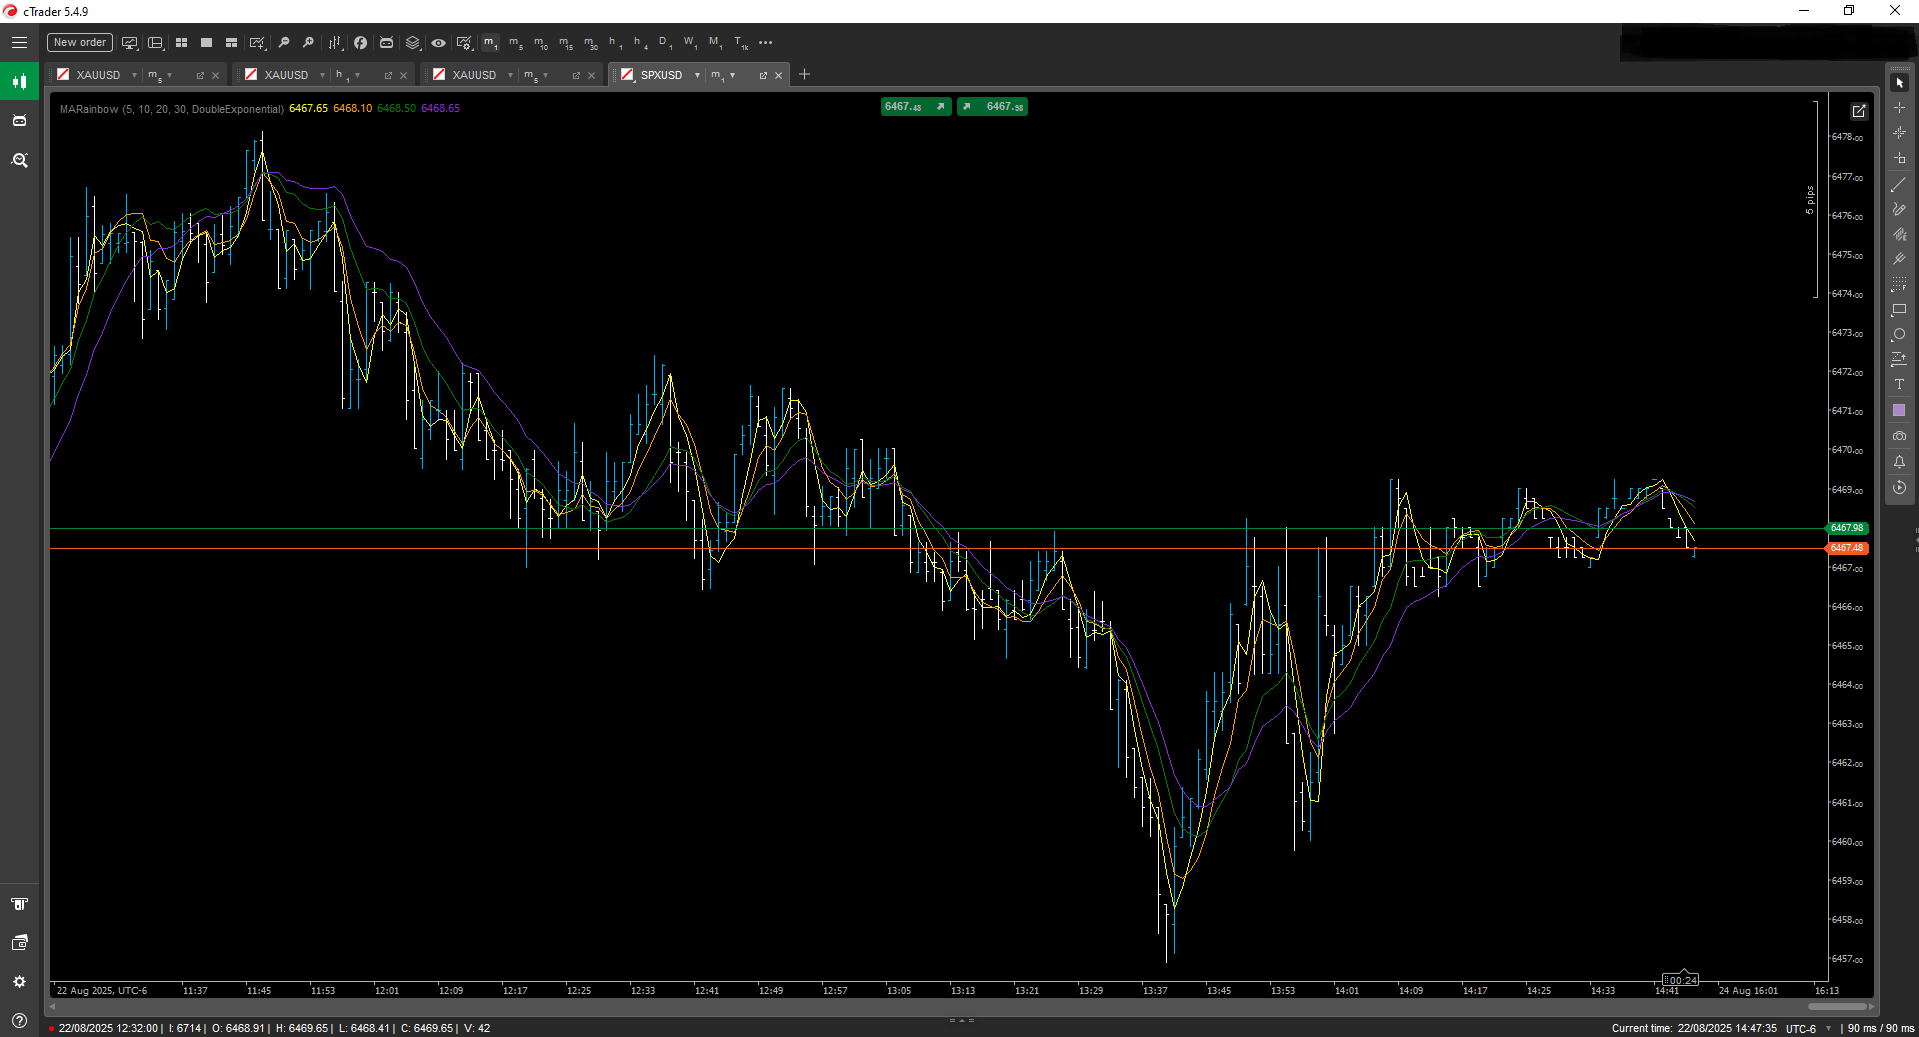
- Transform your charts into a visual symphony of trend clarity.
The MARainbow Indicator is a sleek, multi-layered moving average tool designed for traders who demand precision, flexibility, and aesthetic clarity. Whether you're scalping intraday moves or analyzing long-term trends, MARainbow gives you the edge with four customizable moving averages—each color-coded for instant recognition.
🔧 Key Features
• Four Distinct Moving Averages
Display up to 4 moving averages simultaneously, each with its own color and period setting for quick visual differentiation.
• Multiple MA Types
Choose from:
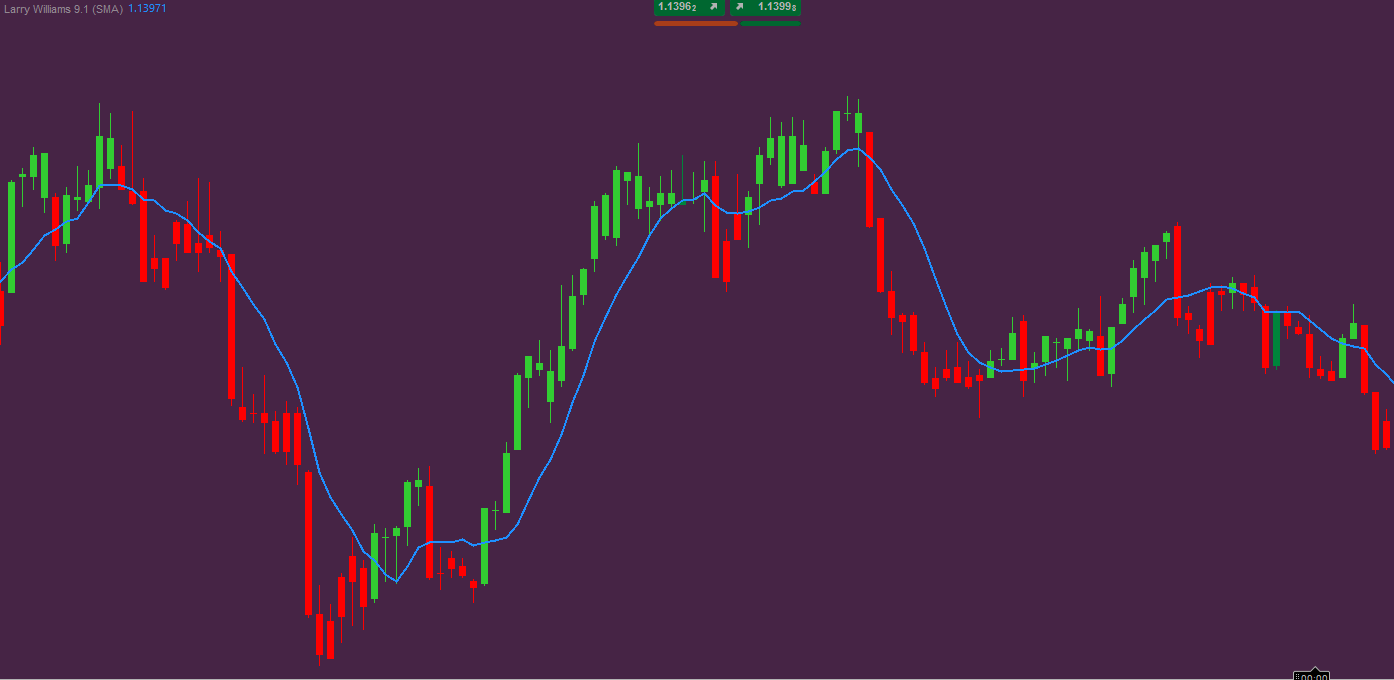
• Simple Moving Average (SMA)
• Exponential Moving Average (EMA)
• Double Exponential Moving Average (DEMA)
• And others.
Mix and match to suit your strategy.
• Customizable Inputs
• Select individual periods for each MA
• Assign unique colors for better chart readability
• Toggle visibility for each line independently
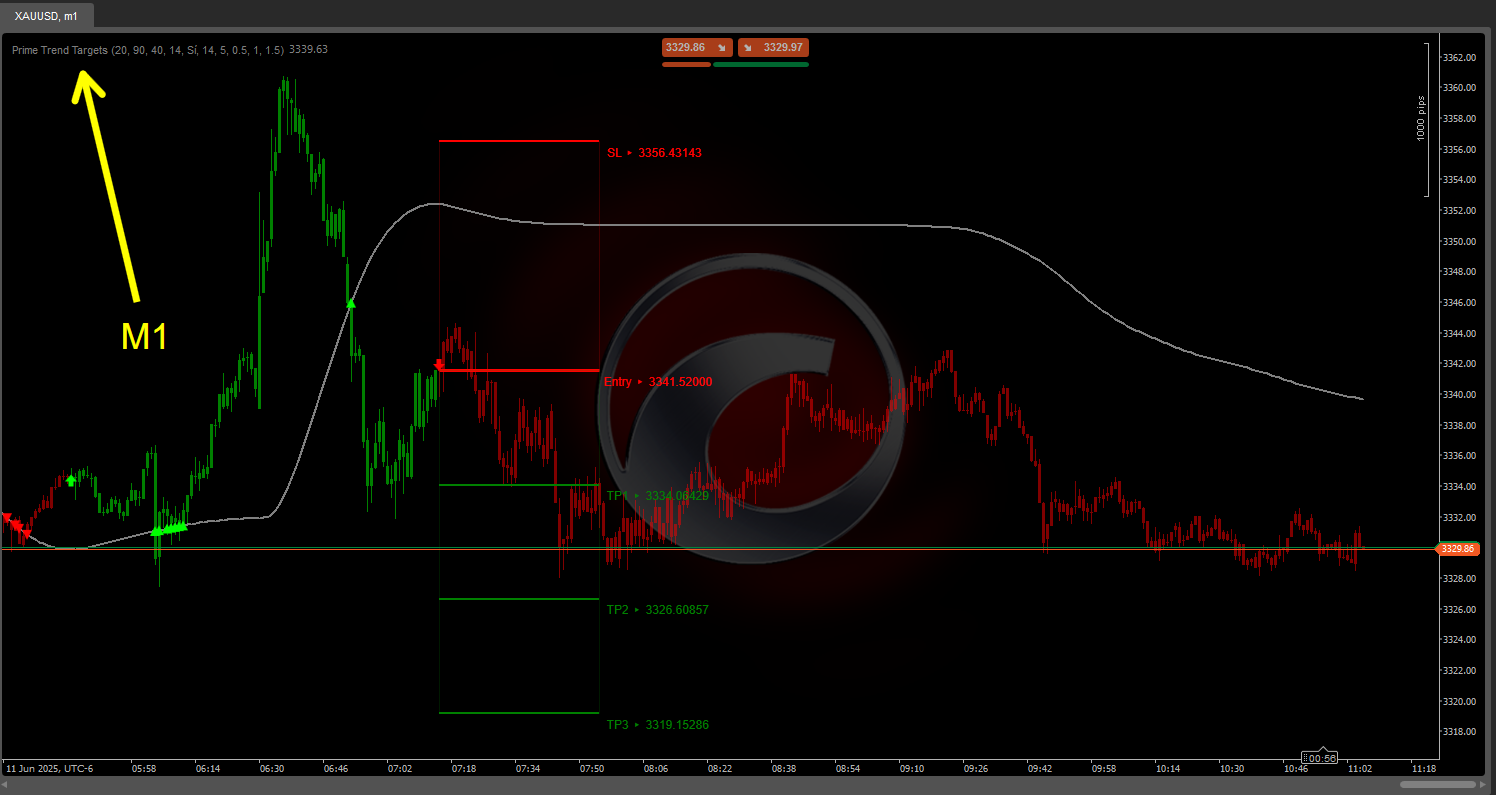
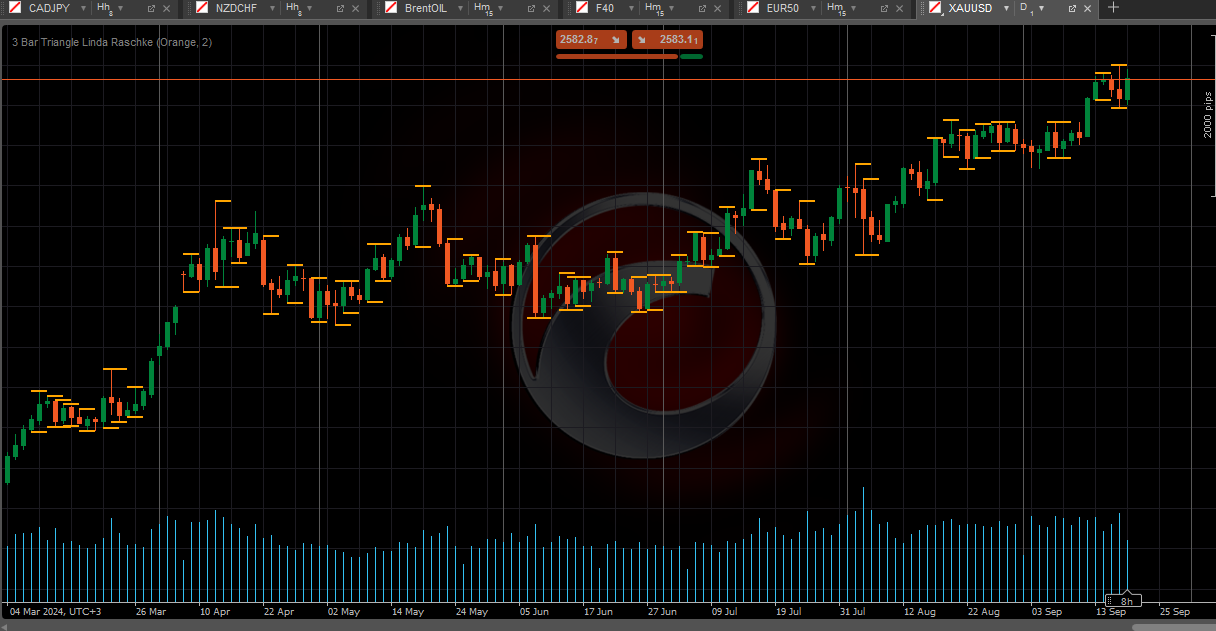
• Trend Clarity at a Glance
The rainbow effect helps you instantly identify trend direction, strength, and potential reversals—no more second-guessing.
• Optimized for cTrader
Seamlessly integrates with the cTrader platform, offering smooth performance and intuitive settings.


.png)

!["[Hamster-Coder] Pivot Points MTF" logo](https://market-prod-23f4d22-e289.s3.amazonaws.com/08b4bf19-ebf2-422e-9a8a-b4a97bc636ca_Icon300.jpg)