Indicator
Indices
Prop
Commodities
Stocks
Forex
Crypto
Fractals
"Fractals" logo
04/09/2025
1
Desktop
Since 08/08/2025
Sales
2
Free installs
241
"Fractals" uploaded image

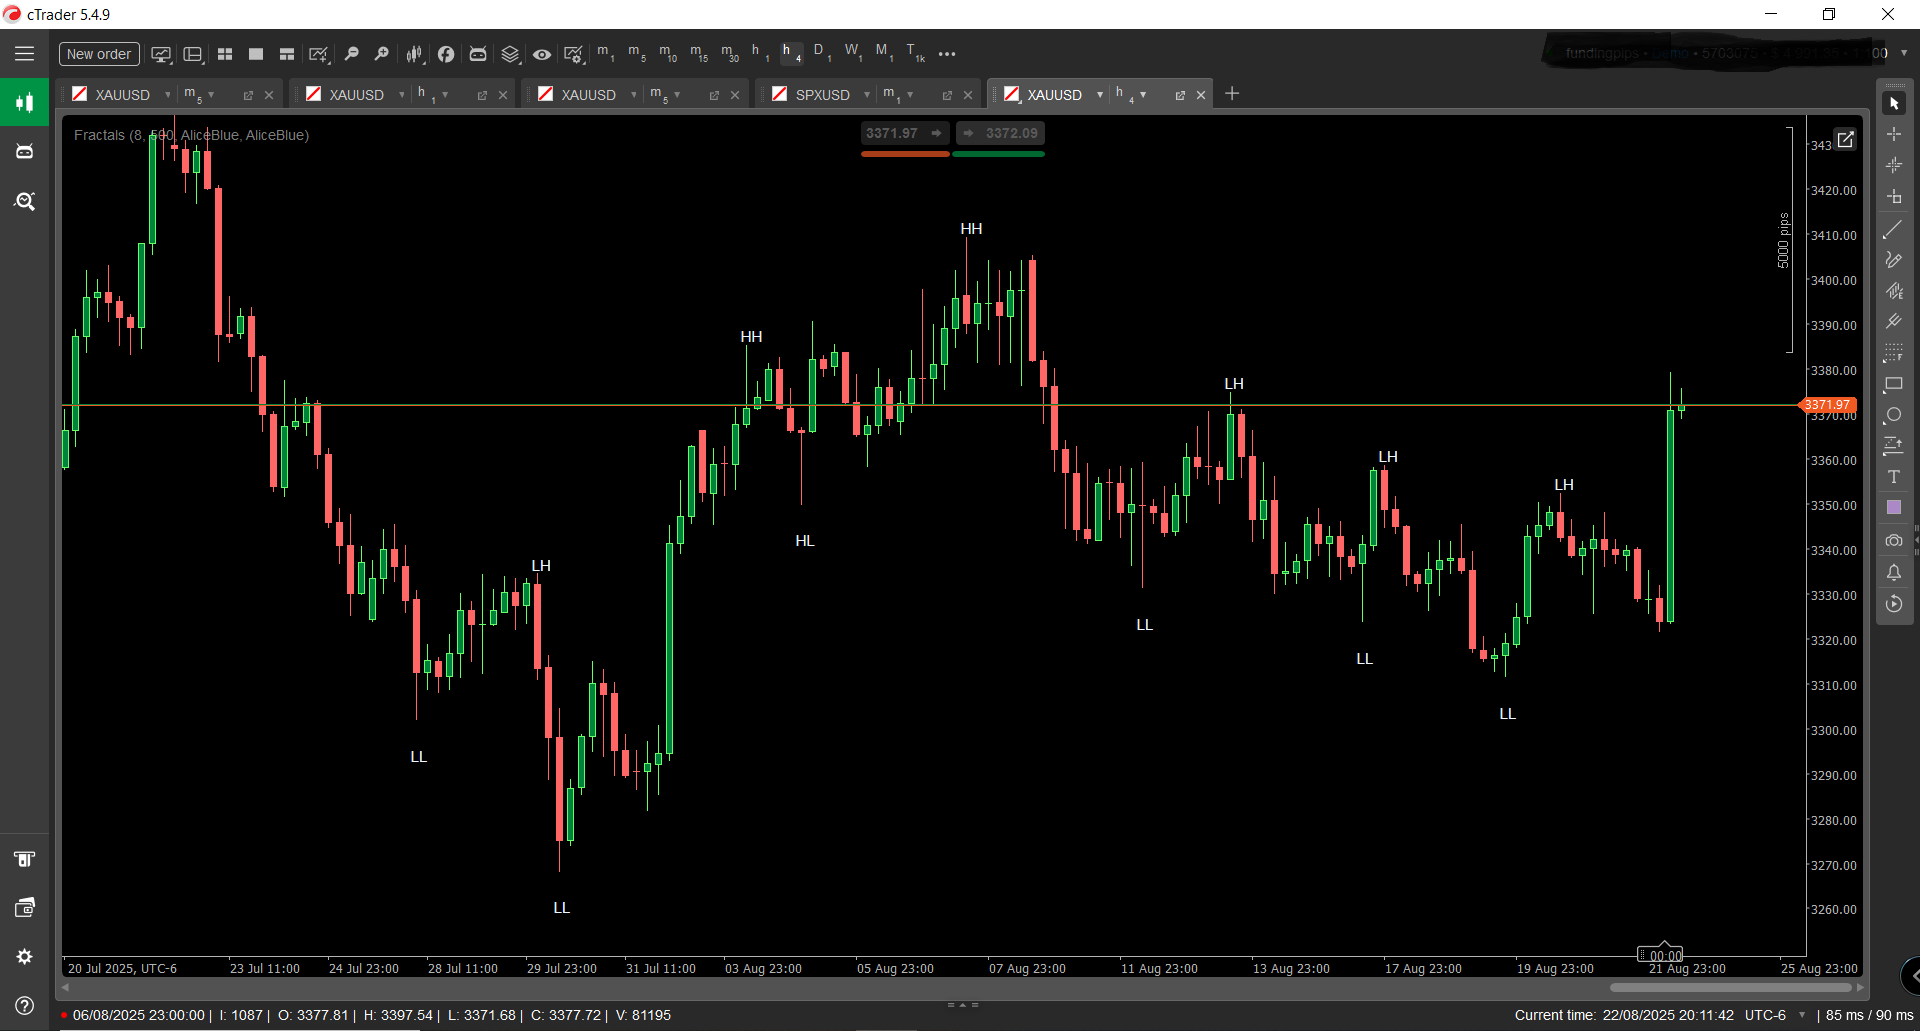
🧠 Fractals – Market Structure Visualized

Fractals is a precision-engineered trading indicator for cTrader that reveals the hidden architecture of price action. By automatically detecting and labeling Higher Highs (HH), Higher Lows (HL), Lower Highs (LH), and Lower Lows (LL) directly on the chart, Fractals transforms raw price data into a clear, actionable map of market structure.

🔍 Key Features:

  • Real-Time Structure Mapping: Instantly identifies swing points and labels them to expose trend direction and reversal zones.
  • Multi-Timeframe Awareness: Designed to highlight macro structure on higher timeframes, giving traders a strategic edge in aligning entries with dominant trends.
  • Trend Following Optimization: Ideal for traders using momentum, breakout, or pullback strategies, helping confirm bias and avoid counter-trend traps.
  • Clean Visual Overlay: Elegant chart annotations that integrate seamlessly with any trading setup, enhancing clarity without clutter.

🧭 Use Cases:

  • Spot emerging trends and structural shifts before they’re obvious.
  • Validate trade setups with structural confirmation.
  • Combine with moving averages, volume, or custom indicators for layered confluence.
  • Perfect for manual backtesting and prop firm evaluations where structure-based logic is key.
More from this author
FVG
The Indicator is a powerful tool for price-action traders seeking to identify and exploit short-term imbalances.
Indicator
Indices
Prop
Stocks
+3
Smooth Heiken Ashi
The Smooth Heiken Ashi indicator is a refined charting tool designed to filter out market noise and highlight true price
pATR
An indicator that redefines ATR by applying a percentile-based filter giving traders a grounded view of volatility.
DEnvelopSystem
DEnvelop is a high-performance trading indicator engineered for scalpers and intraday strategists who demand precision.
Indicator
NAS100
Indices
XAUUSD
+4
PrevDayProjection
Automatically calculates the previous day’s high and low, determines the range, and then projects Fibonacci levels.
Indicator
Indices
Prop
Breakout
+3
RVI
A precision-crafted indicator that compares current volume to its historical average for the same time of day.
Indicator
Grid
NAS100
XAUUSD
+6
AutoFibRetracement
A powerful overlay tool designed to automatically plot Fibonacci retracement levels based on a custom window.
Indicator
Indices
Commodities
Stocks
+2
MARainbow
MARainbow gives you the edge with four customizable moving averages—each color-coded for instant recognition.
Indicator
Breakout
AI
Scalping
KaufmanEfficiencyRatio
A precision tool for measuring how efficiently price moves from point A to B.
Indicator
Indices
XAUUSD
Breakout
+3
AnchoredVWAP
A precision overlay tool that combines session-aware VWAP logic and standard deviations.
Indicator
Indices
Breakout
Prop
+8
MarketRegimeAI
A cutting‑edge trading indicator that fuses AI and mathematics with adaptive logic to classify market regimes.
ORB2
A high-performance cBot engineered to capture explosive moves in the gold market using the proven Opening Range Breakout
Indicator
Indices
Prop
Commodities
+3
OBScope
A cutting-edge indicator designed to detect and visualize high-probability zones based on swing highs, swing lows.
You may also like
Indicator
Indices
Prop
Stocks
+3
[Hamster-Coder] Moving Average MTF
Universal multi time frame 'Moving Average' indicator with extended features
Top-rated
Free
Indicator
ATR
Supertrend
PMAX
It's a combination of two trailing stop loss and the other one is well-known ATR-based SuperTrend.
VolumeRenkoRange
Volume for Renko/Range
Indicator
NAS100
NZDUSD
Martingale
+26
Info Dashboard_noSourceCode
Read the market with AI: live sentiment, news impact, equity, spread & neural net signals in one dashboard.
Multi_TF Candlestick Chart Overlay
Perfect for traders who demand a clear overview of multiple timeframes at a glance.
Volume Profile Triple Line - POC Median Mode
The Advanced Volume Profile Indicator calculates POC, Median, and Mode, revealing key price levels for smarter trading.
SpreadCalculator - BossFXTrader
Spread Calculator to calculate the difference between two prices or values.
PriceLevels
Displays the previous day's, last week's, and last month's highest and lowest price levels on your chart.
Bars color 1
This is the first version I offer you for free.
FVG
The Indicator is a powerful tool for price-action traders seeking to identify and exploit short-term imbalances.
Clarosti
Clarosti a chave para decisões inteligentes no mercado
FAIR VALUE GAP INDICATOR
Pinpoint FVGs, track fills and see mitigation stats — trade imbalances with clarity and confidence.
Market Sessions Advanced
Advanced Market Sessions with ICT killzones
IR Candle MTF
with this indicator you could see other time frame candle in your chart.
Indicator
Indices
Prop
Stocks
+3
VegaXLR - Unlimited Trendline Alerts
This is an indicator that can alert you about trendlines, horizontal lines and vertical lines.
Indicator
NAS100
NZDUSD
Martingale
+22
Candle Timer
Candle Timer best used for Scalper
Top-rated
"STC" logo
5.0
(2)
Free
STC
Schaff Trend Cycle (STC) Indicator
VolumeThermometer
Heatmap of intra-HTF volume (POC/VA) built from LTF tick data; paints current candle and auto-loads visible history.