Indicator
Grid
NAS100
NZDUSD
Breakout
XAUUSD
FVG
Forex
Fibonacci
Signal
EURUSD
MACD
Bollinger
GBPUSD
BTCUSD
AI
SMC
VWAP
ZigZag
USDJPY
Scalping
Institutional Volume Supply Demand

27/09/2025
2
Desktop
Since 09/01/2025
Free installs
3697
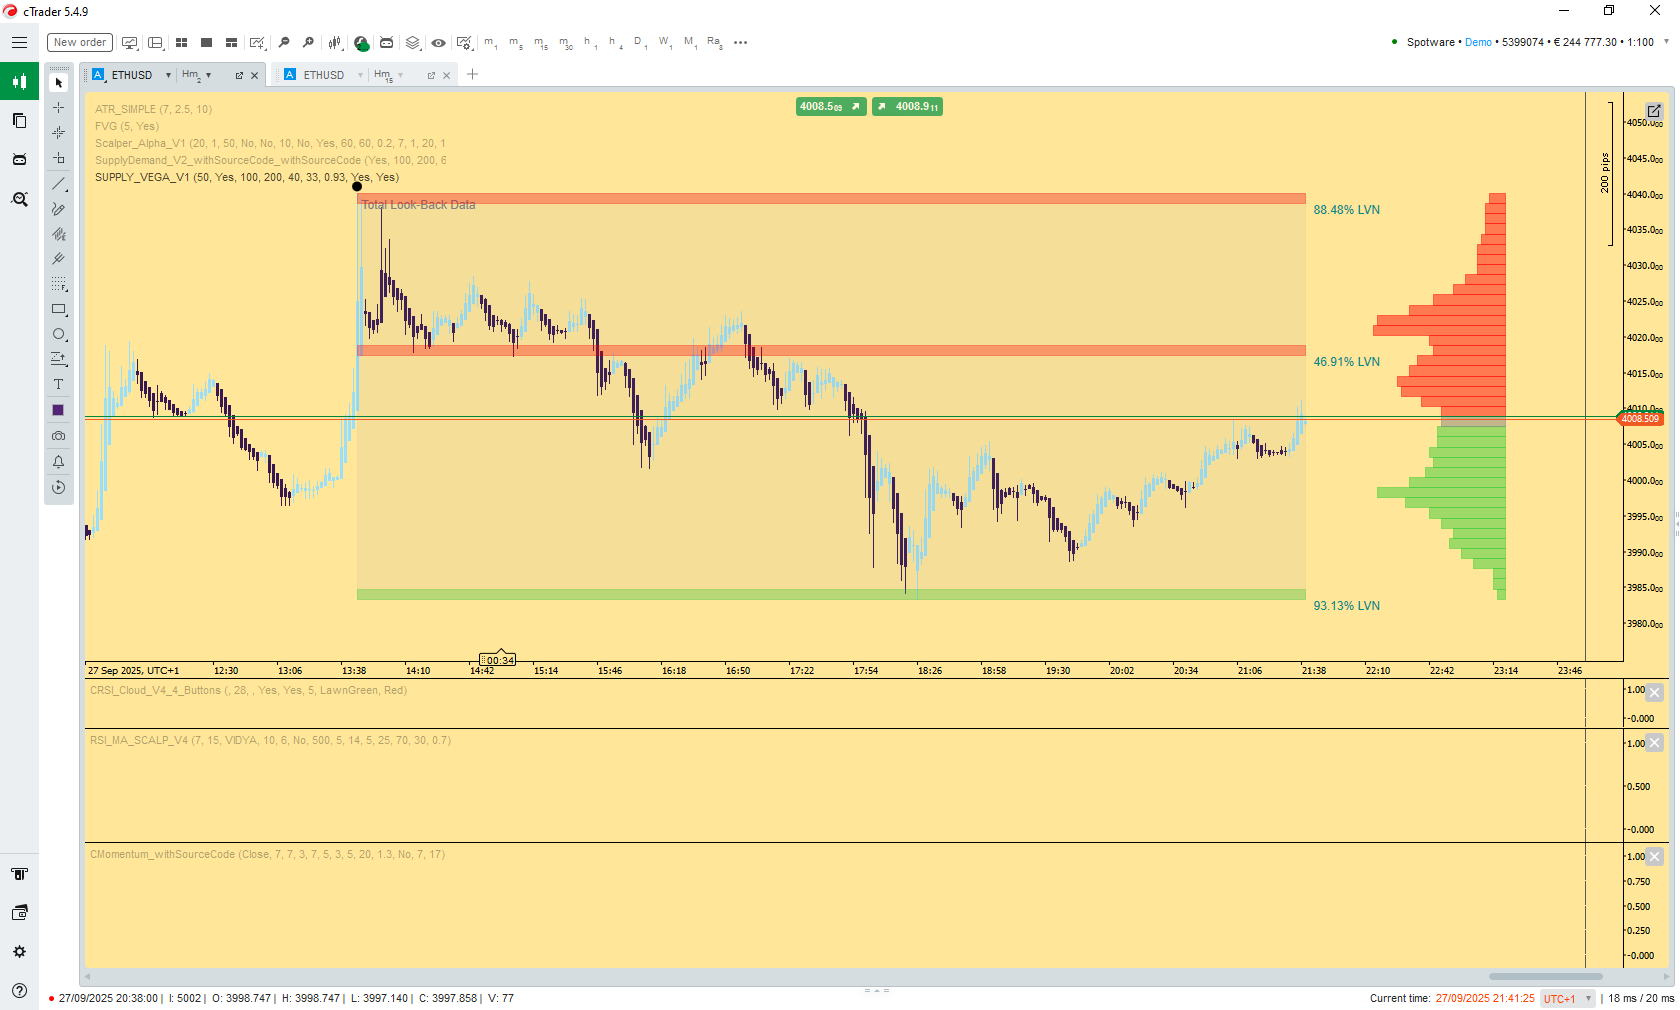
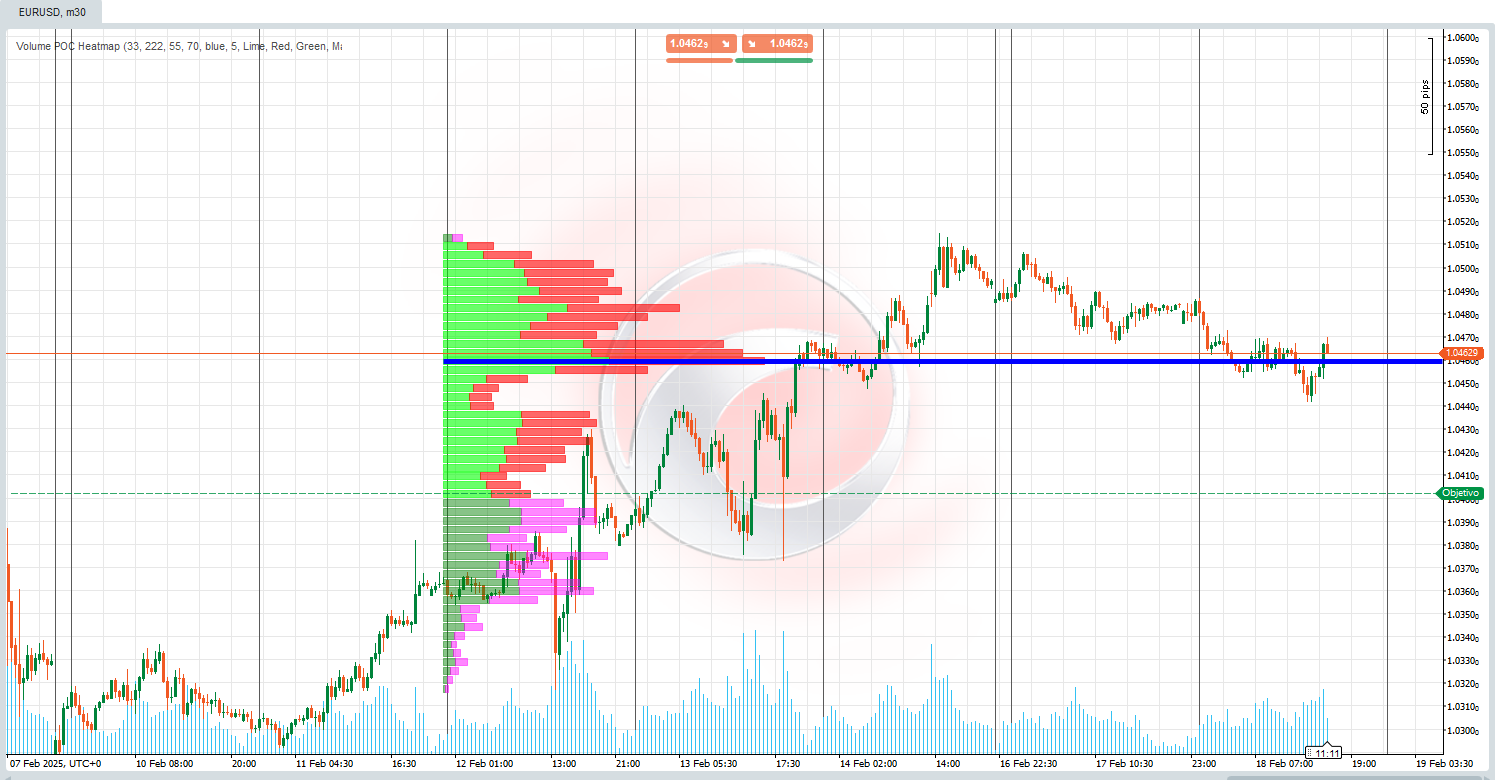
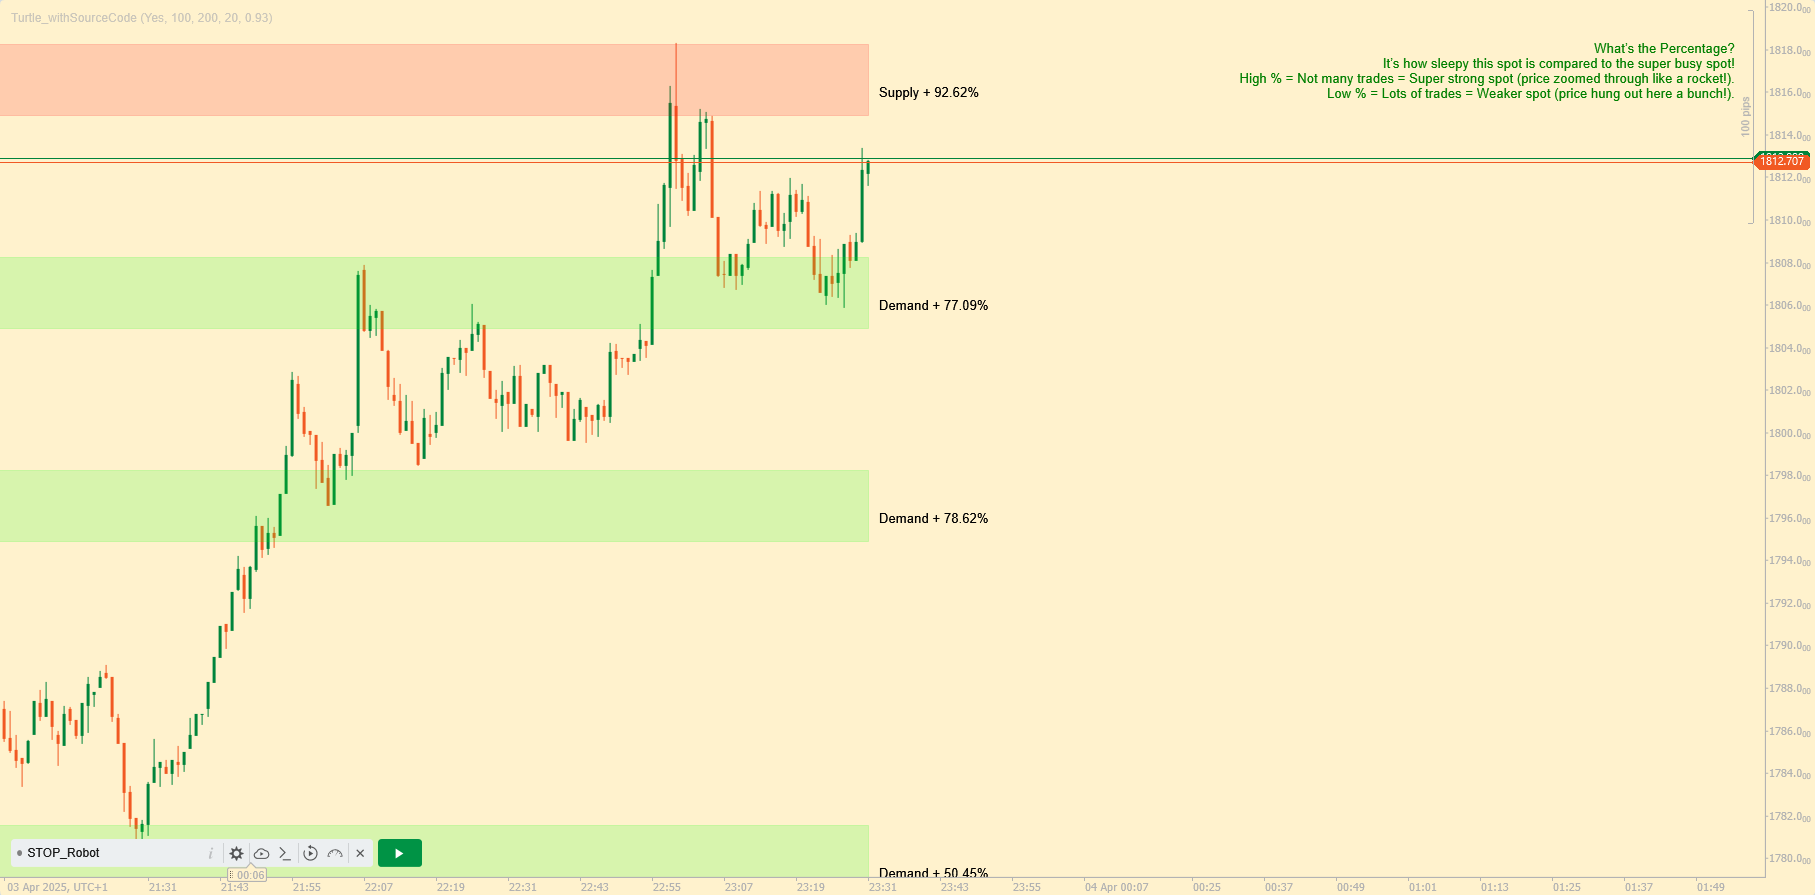
Volume Profile Zones (Supply/Demand)
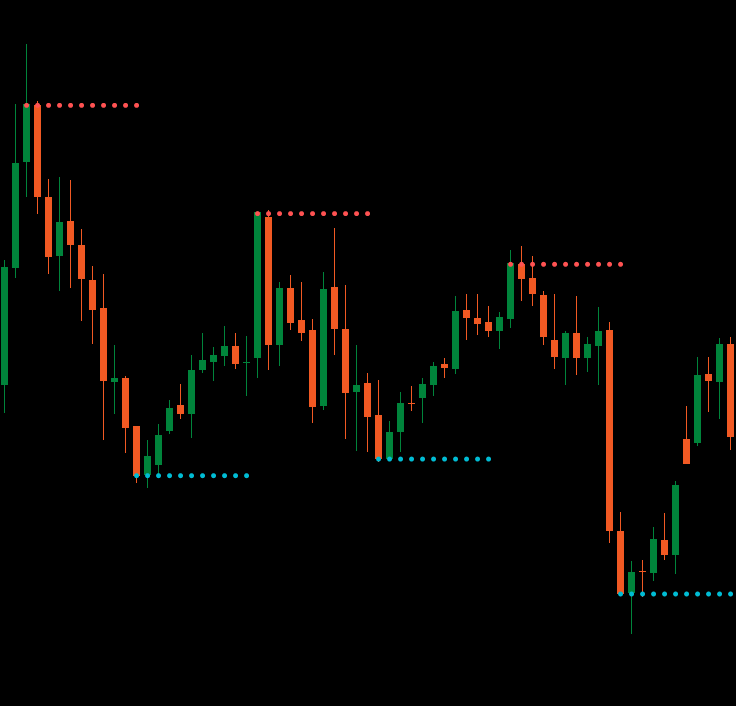
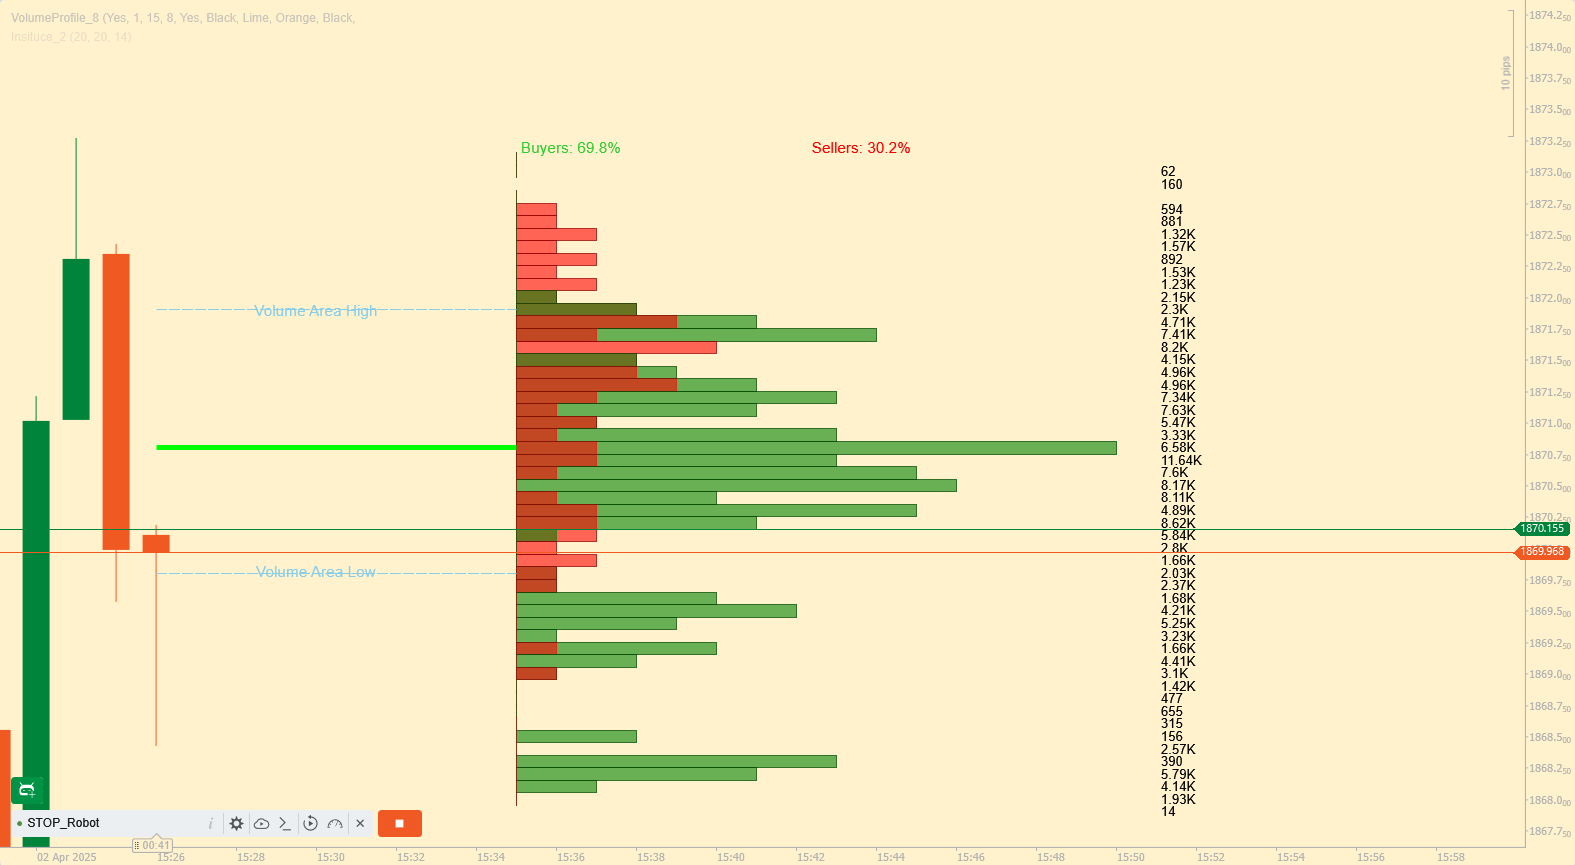
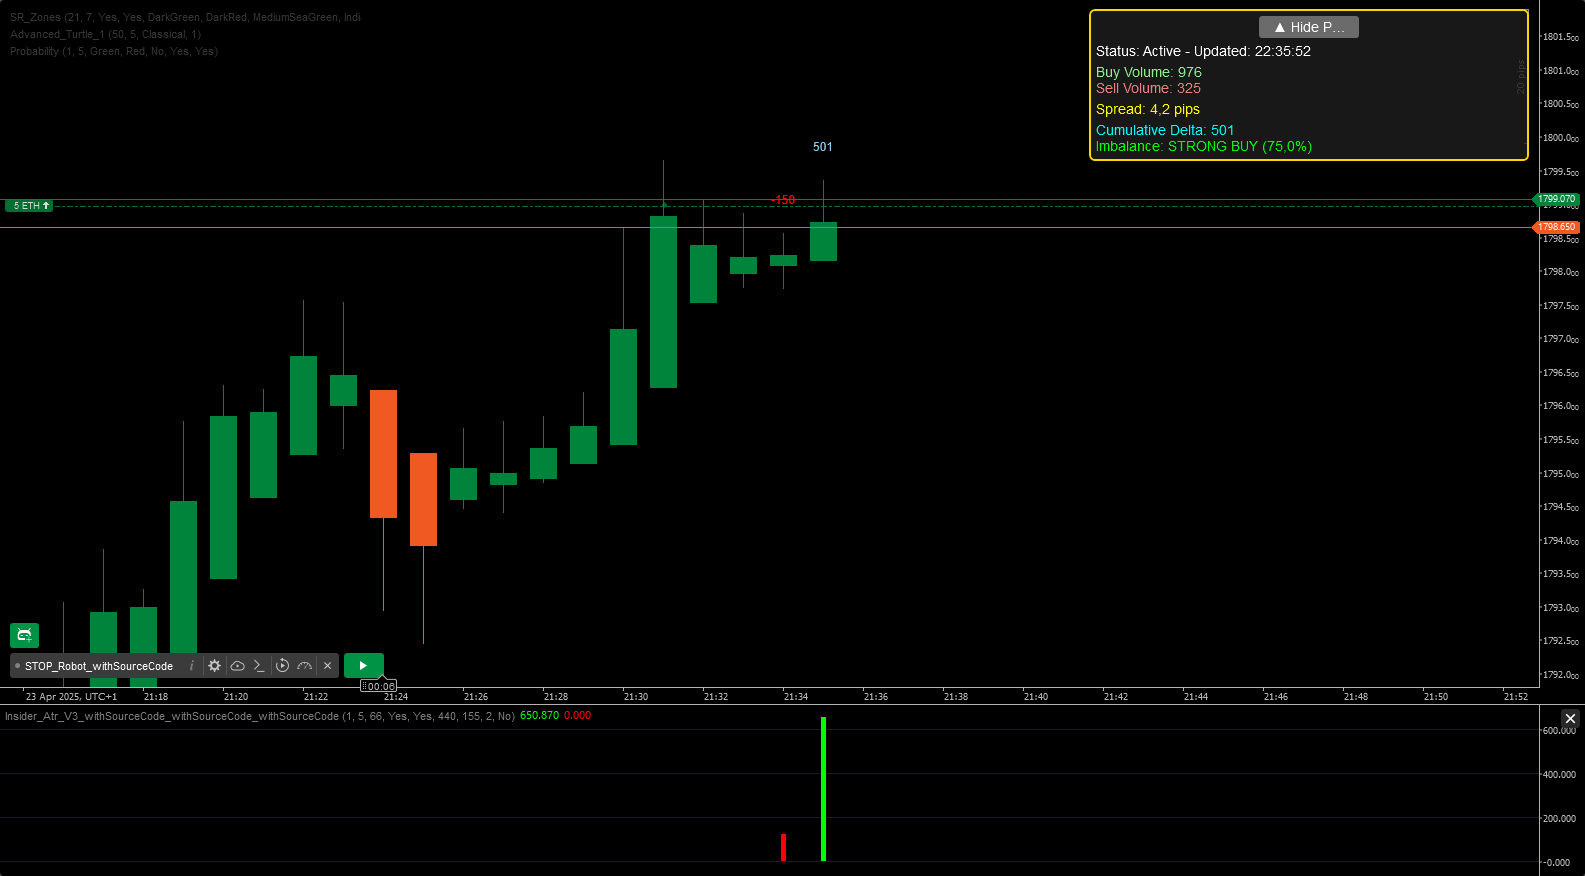
The Volume Profile Zones indicator provides an institutional-grade view of market structure by leveraging Volume at Price analysis. It automatically identifies high-probability Support and Resistance levels based on market inefficiencies and liquidity voids.
Key Features:
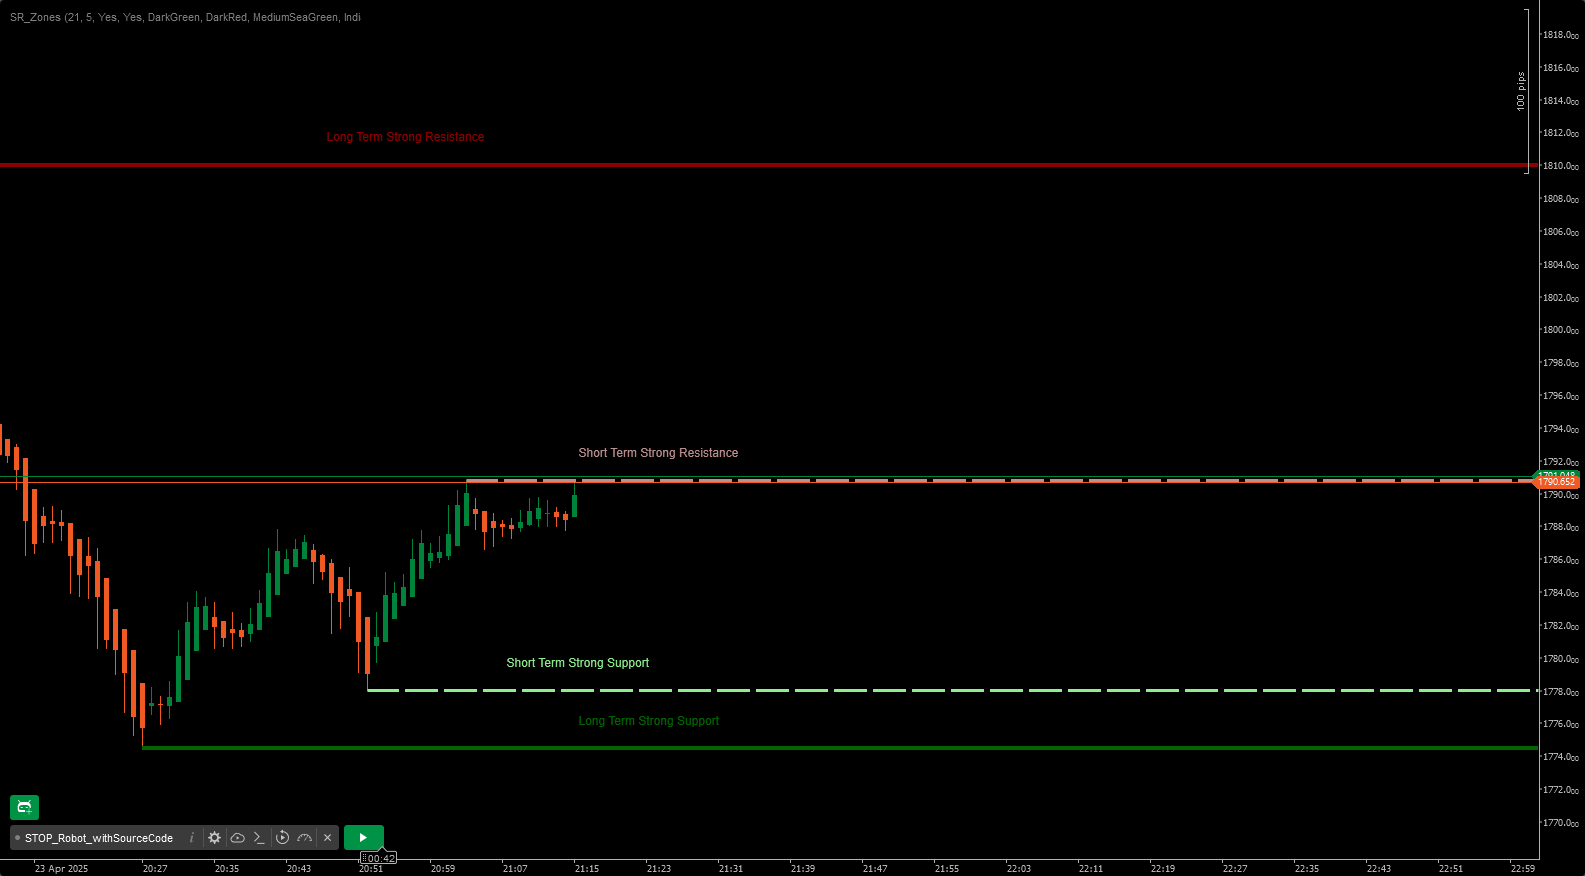
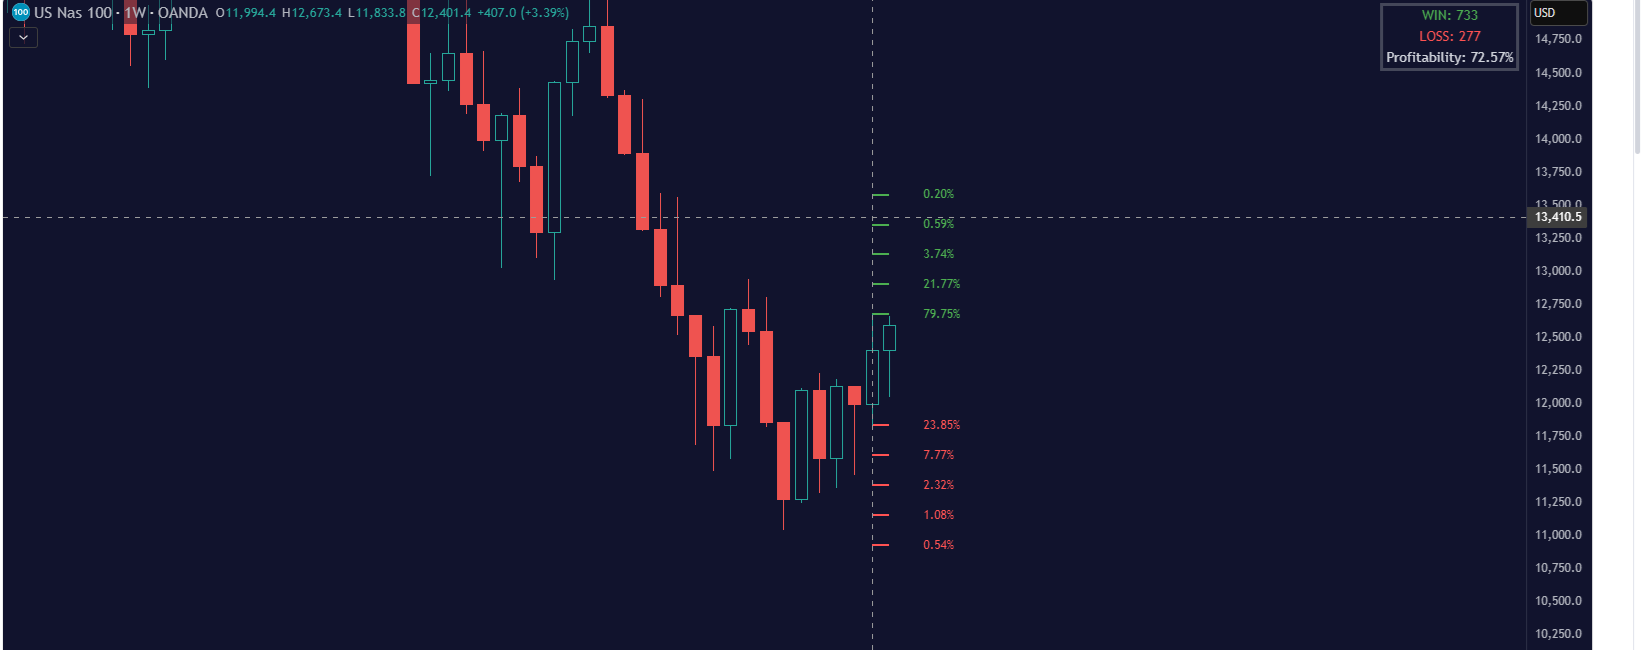
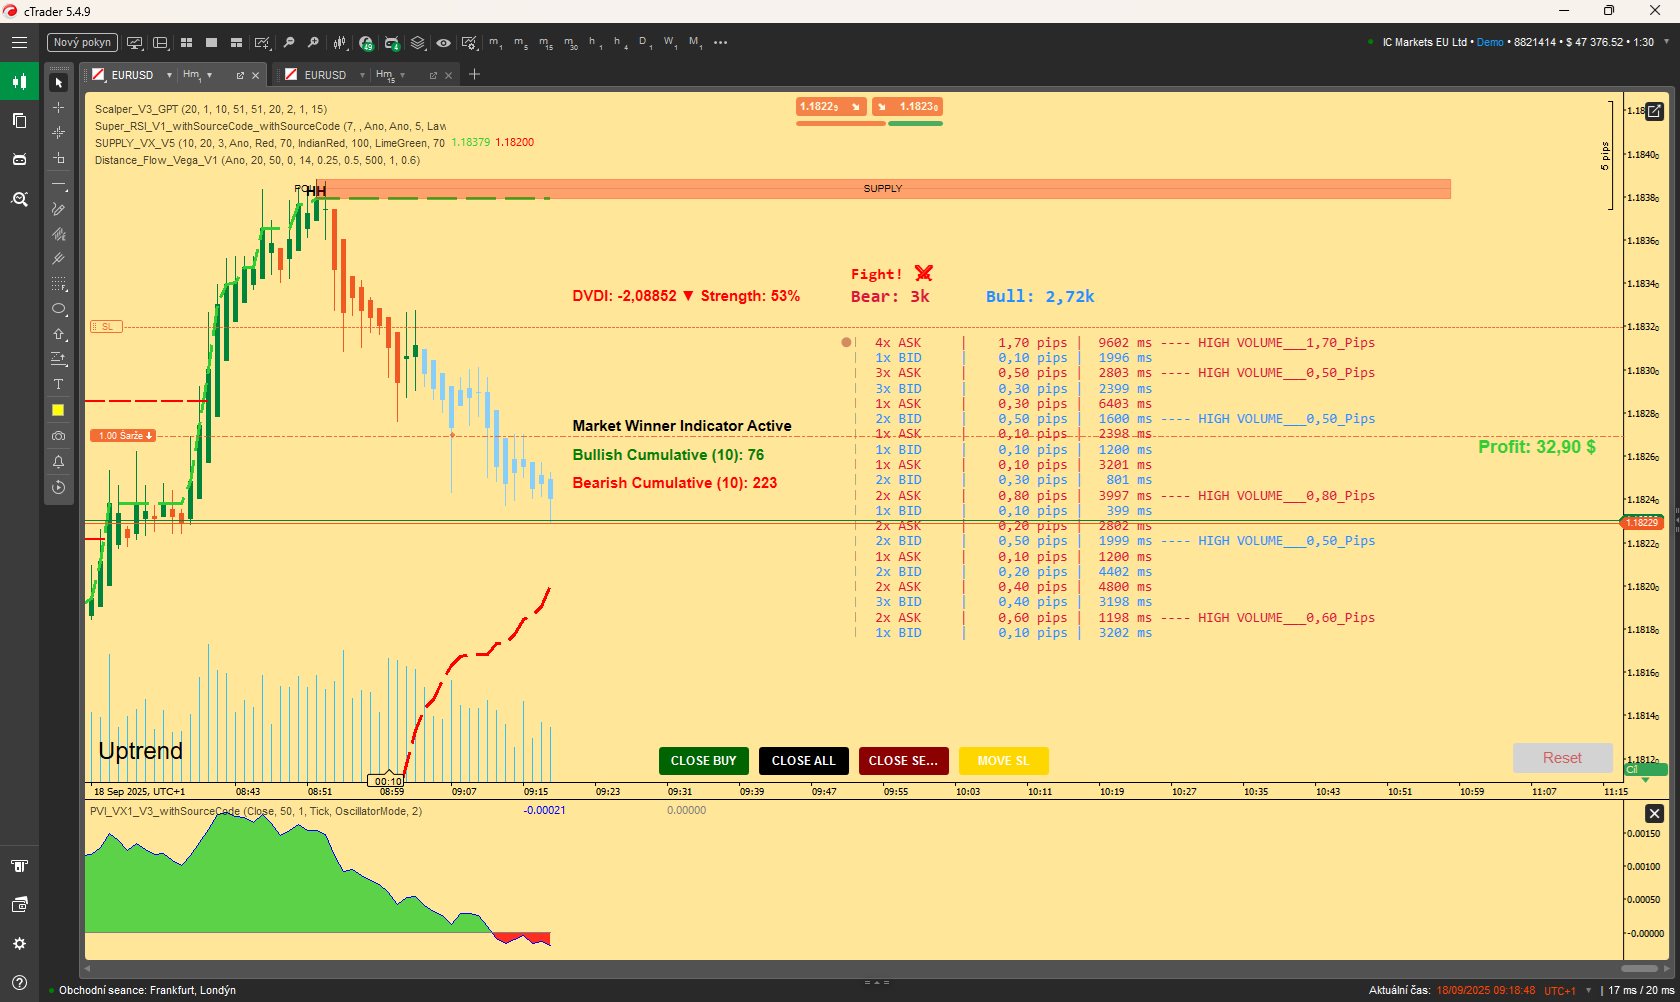
- Institutional S&R (LVNs): Automatically calculates and marks Low Volume Nodes (LVNs)—areas where the price moved quickly with minimal trading volume. These LVNs act as high-conviction future Supply (Resistance) and Demand (Support) zones.
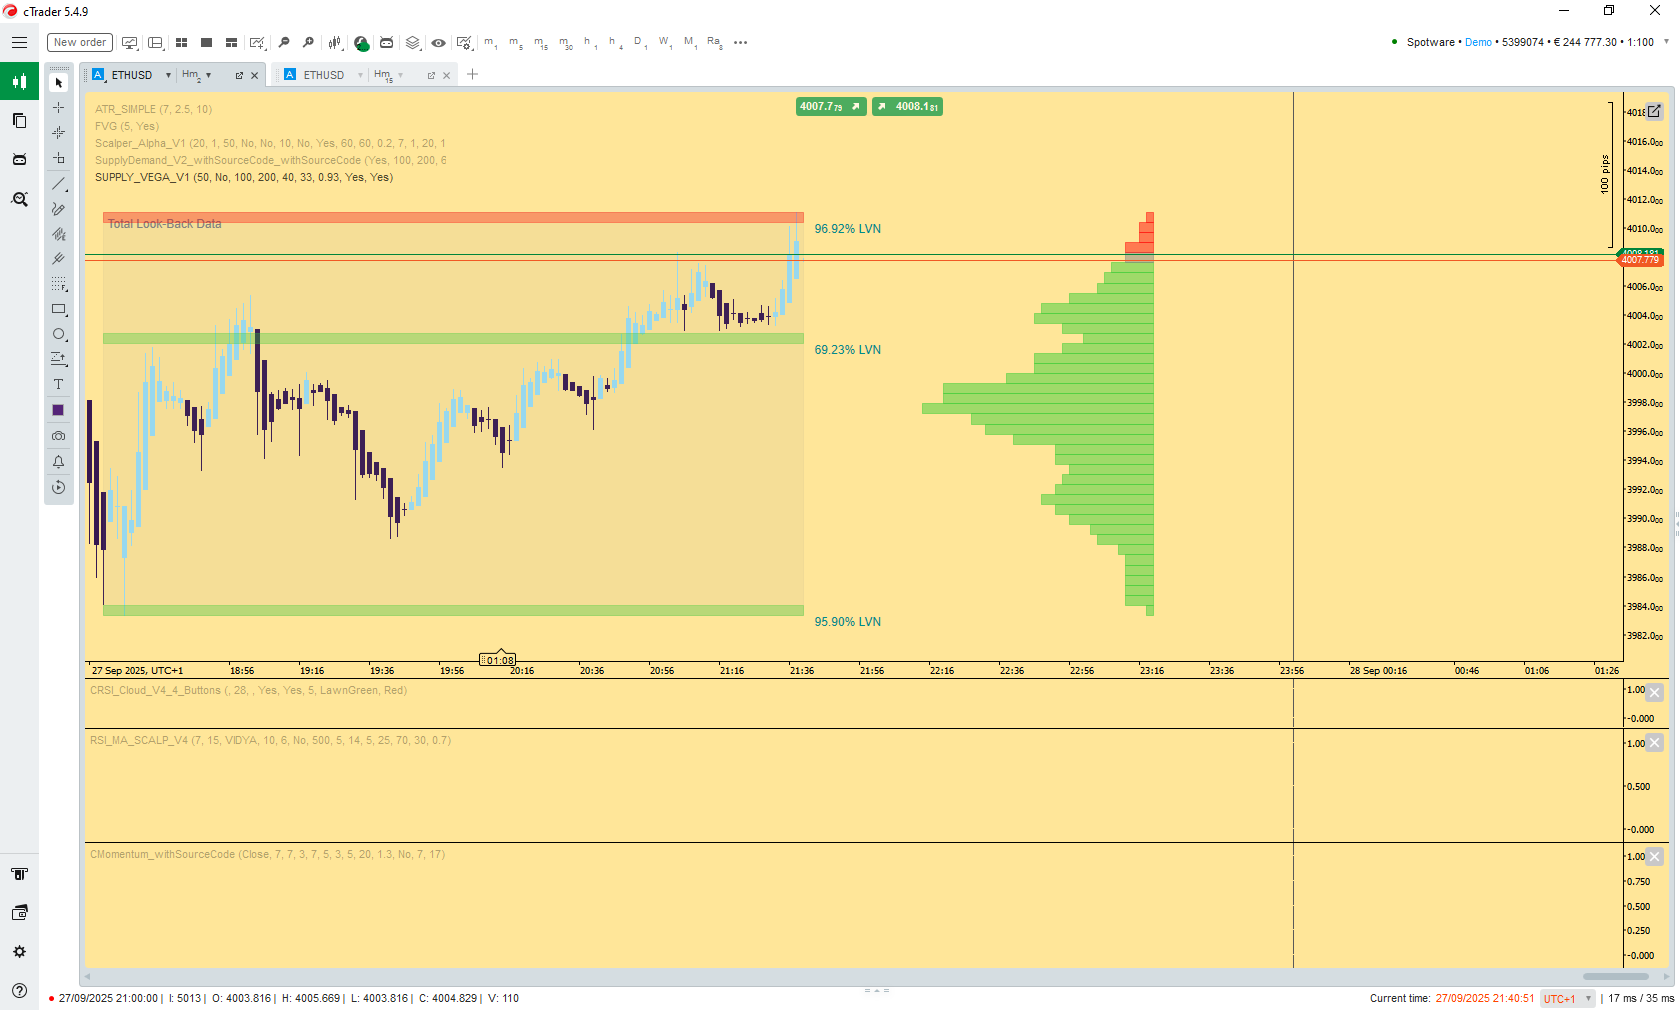
- Dynamic Look-Back: The profile automatically adjusts its analysis period to focus only on the current major swing or trend, resetting after a significant market pivot.
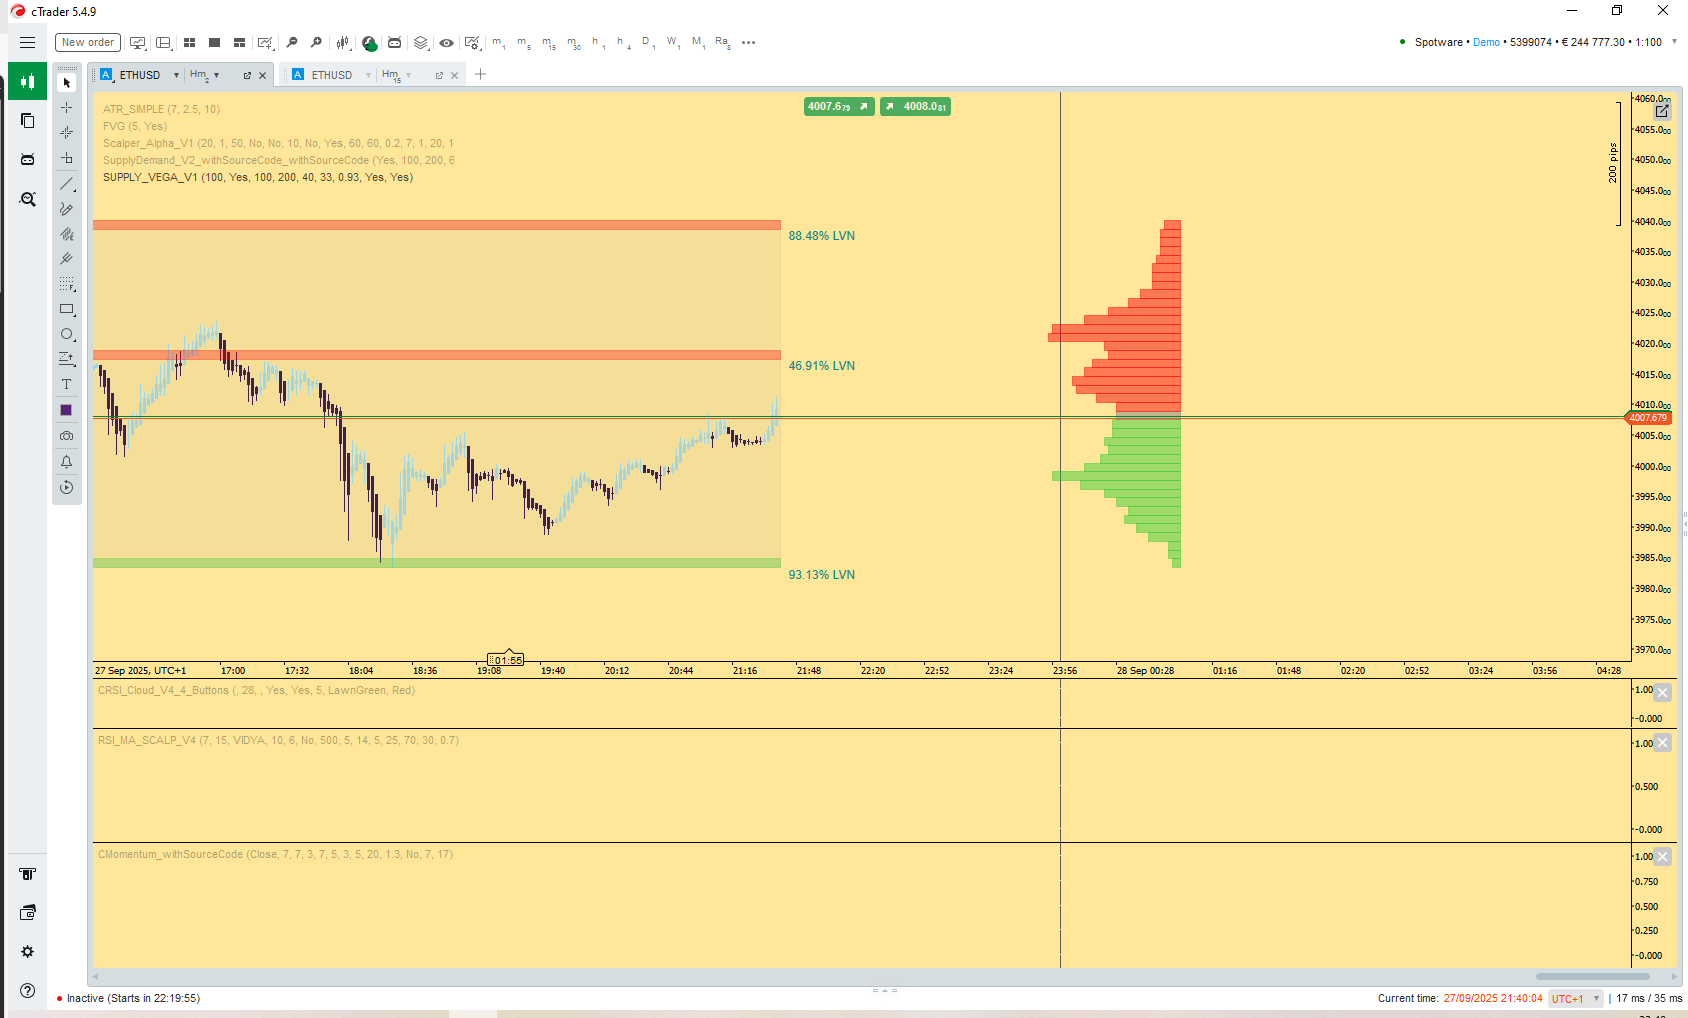
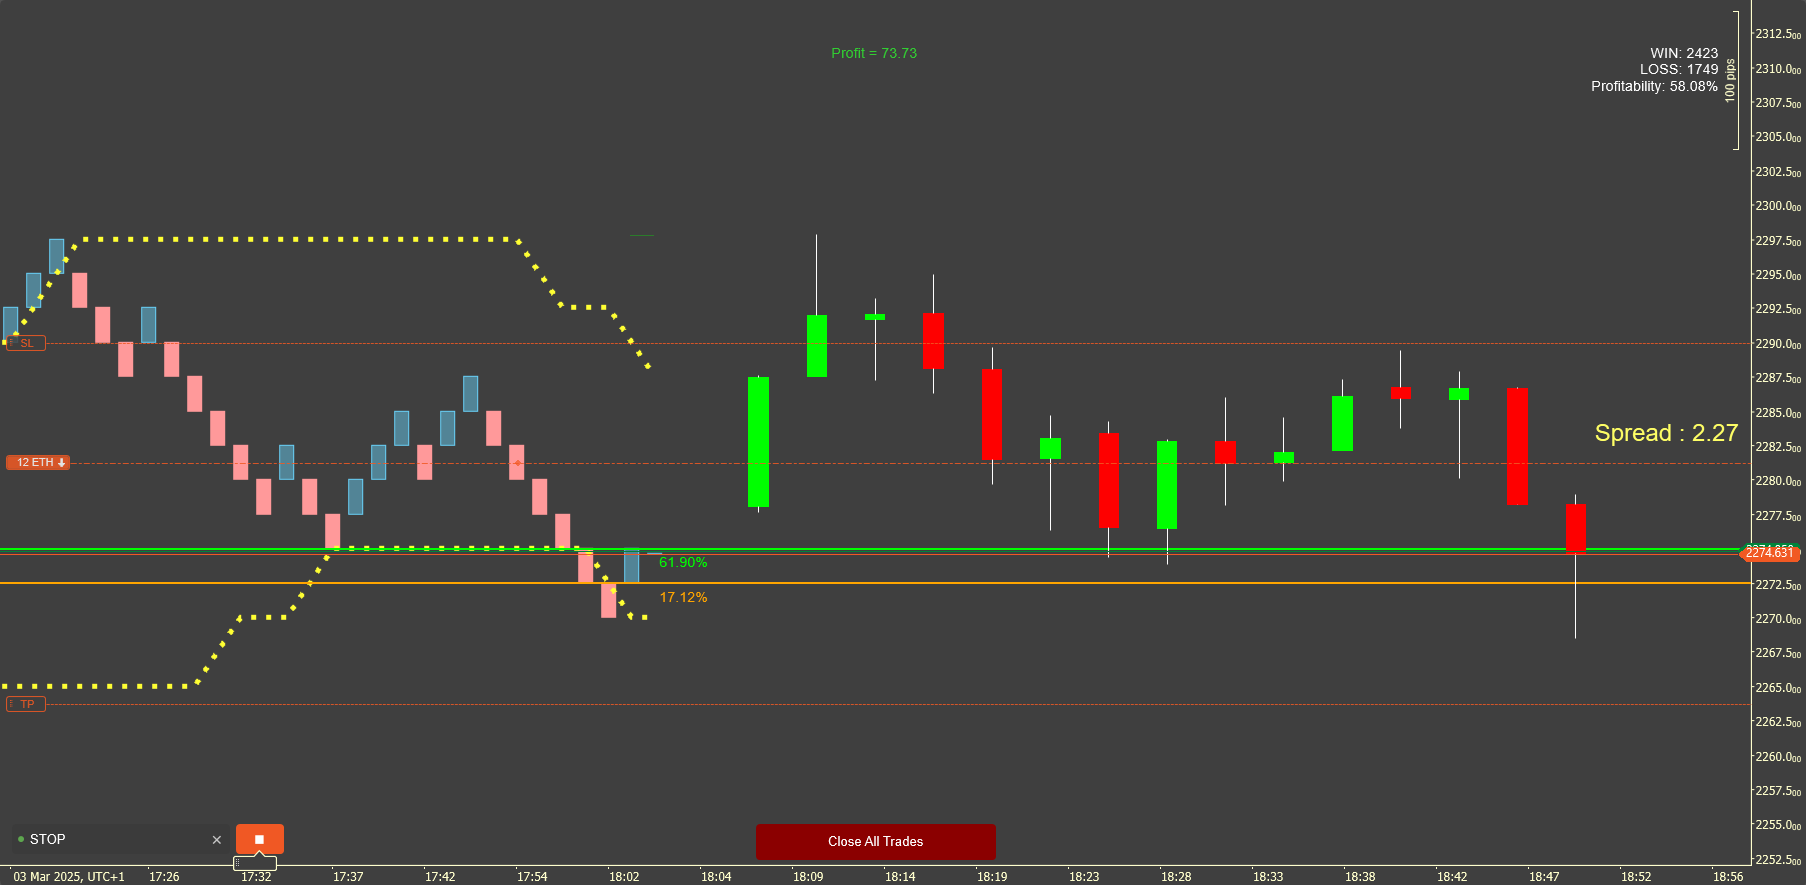
- Price-Relative Coloring: The visible Volume Profile histogram and the corresponding Supply/Demand zones are dynamically colored based on the current price:
- Green: Volume areas below the current price (acting as Demand/Support).
- Red: Volume areas above the current price (acting as Supply/Resistance).
- LVN Strength: Zones are labeled with a percentage indicating the weakness of the volume at that level, providing an objective measure of the zone's theoretical strength (liquidity void size).
This tool is essential for traders who utilize advanced market structure, order flow, or Volume Profile techniques to identify key points of interest and anticipate market turns.
More from this author
Top-rated
Indicator
Breakout
BreakOut_Probability_Expo
Break Out Probability Experimental indicator. Credits for this indicator goes to Zeiierman !!!

You may also like

.jpeg)

Indicator
Forex
VegaXLR - Market Sessions Alerts
The cTrader Market Sessions Alerts Indicator marks global sessions, highlights key levels, and sends real-time alerts.
!["[Hamster-Coder] Pivot Points MTF" logo](https://market-prod-23f4d22-e289.s3.amazonaws.com/08b4bf19-ebf2-422e-9a8a-b4a97bc636ca_Icon300.jpg)
.jpeg)
Indicator
RSI
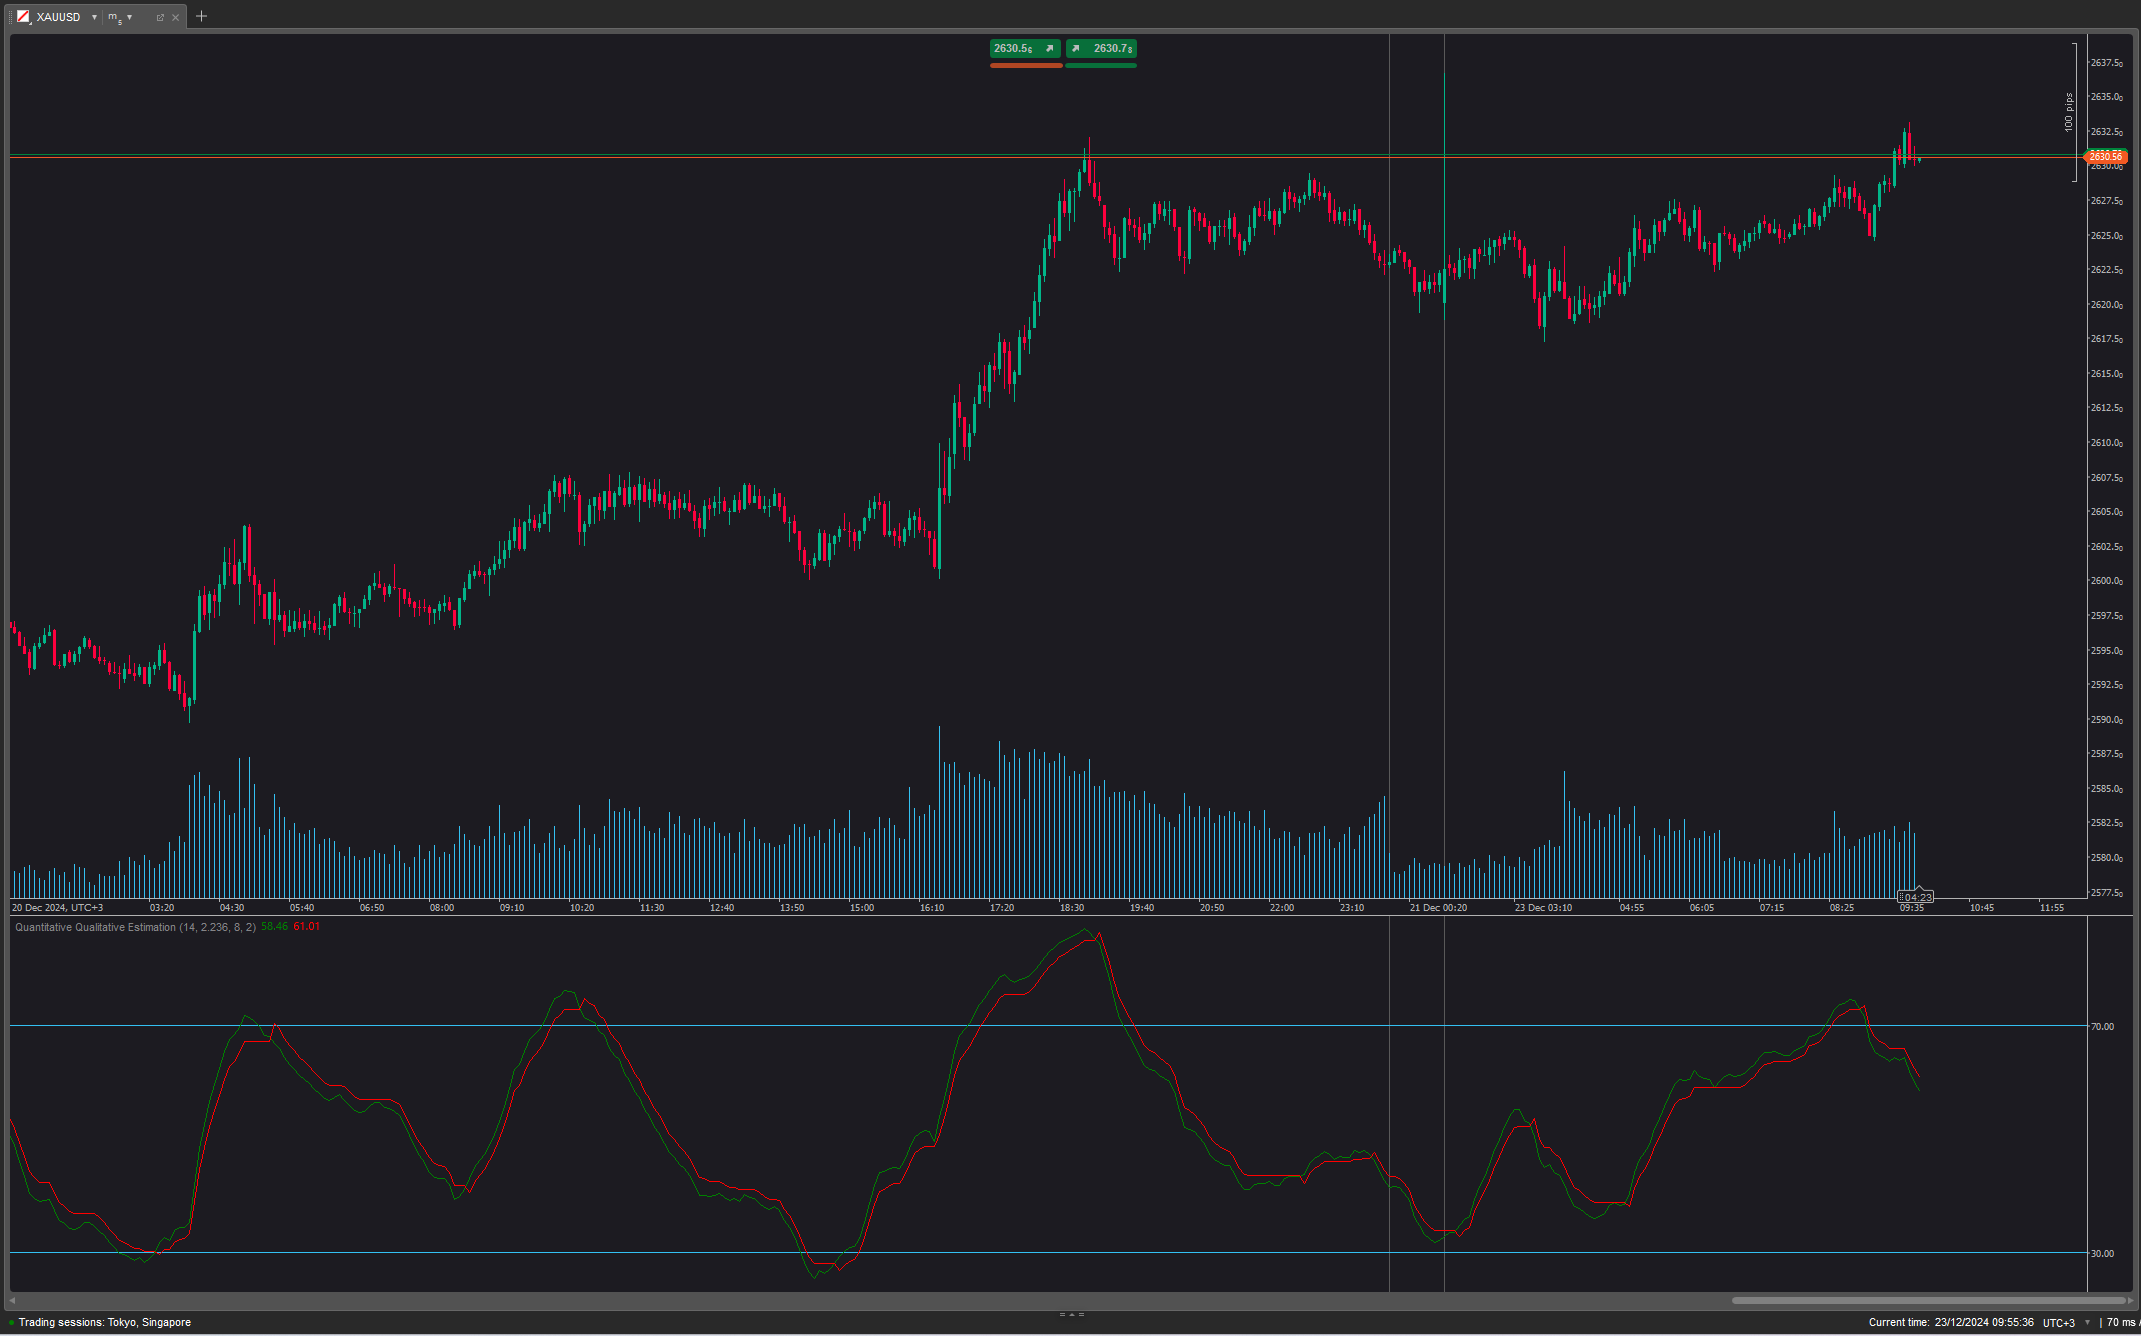
Quantitative Qualitative Estimation
The QQE (Quantitative Qualitative Estimation) Weighted Oscillator improves its original version by weighting the RSI.