present
Daftar dan dapatkan diskon $50 untuk pembelian pertama Anda
Trading product for High Value Consolidation zones Scanner Indikator Flag Key Levels, image 1
High Value Consolidation zones Scanner
Indikator
Versi 1.0, Aug 2026
Windows, Mac
Trading product for High Value Consolidation zones Scanner Indikator Flag Key Levels, image 2
Trading product for High Value Consolidation zones Scanner Indikator Flag Key Levels, image 3
Trading product for High Value Consolidation zones Scanner Indikator Flag Key Levels, image 4
Trading product for High Value Consolidation zones Scanner Indikator Flag Key Levels, image 5
Sejak 14/01/2025
2
Penjualan
165
Instal gratis

Deskripsi

HIGH VALUE CONSOLIDATION ZONES SCANNER


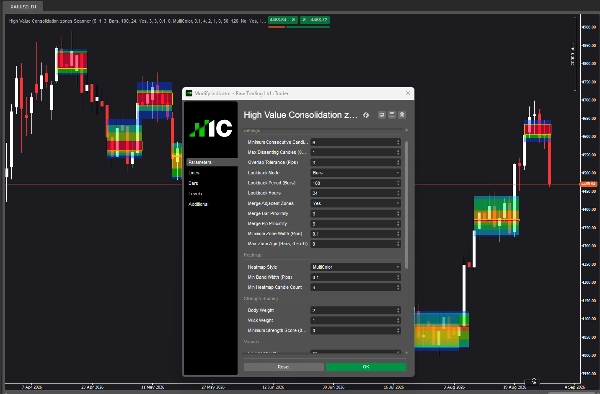
Intelligent Consolidation Detection with Heatmap Visualization


--------------------------------------------------


Find high-probability consolidation zones. See where price actually traded.


--------------------------------------------------


WHAT THIS INDICATOR DOES


Most consolidation scanners simply draw boxes around price ranges. This indicator goes further by analyzing the quality of each touch — distinguishing between body-in-zone (strong participation) and wick-only (weak participation) touches.


The result is a heatmap that shows you exactly where price has spent the most time within each zone, helping you identify the most reliable levels for entries, exits, and stop placement.


--------------------------------------------------


CORE LOGIC AND CALCULATION


The indicator scans recent price action for overlapping candle ranges. When a sufficient number of candles overlap consistently, a consolidation zone is detected. The minimum consecutive candles required is configurable, as is the maximum number of dissenting candles allowed within the sequence.


For each zone, the indicator tracks how many candles have their body inside the zone versus how many only touch the zone with their wicks. Body-in-zone candles indicate strong participation, while wick-only candles indicate weaker interest. This distinction forms the basis of the strength score.


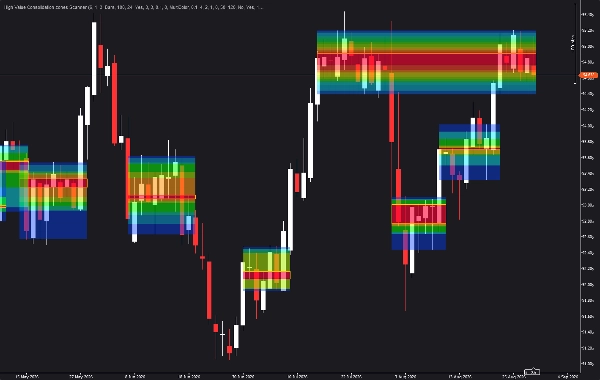
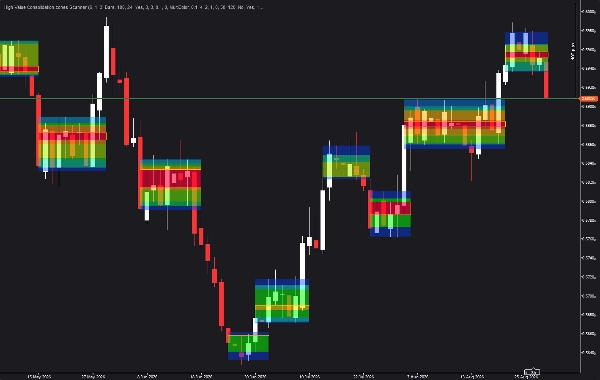
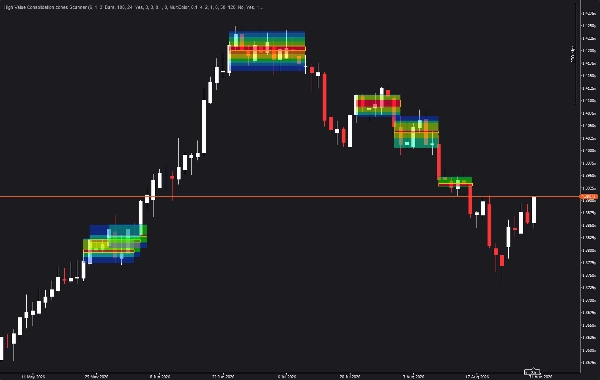
A dynamic heatmap is built by analyzing the distribution of candle activity within each zone. Price levels with higher activity are shown in warmer colors (red/orange), while lower activity levels are shown in cooler colors (blue). This provides an immediate visual of where price has actually traded.


Multiple zones can be merged if they overlap in price and are close in time, reducing chart clutter and creating broader, more meaningful zones.


--------------------------------------------------


KEY FEATURES


- AUTOMATIC CONSOLIDATION DETECTION: Identifies zones where candles consistently overlap, with configurable minimum consecutive candles and dissent tolerance.

- HEATMAP VISUALIZATION: Shows activity density within each zone, with warmer colors indicating higher candle activity.

- BODY VS WICK SCORING: Distinguishes strong touches (body in zone) from weak touches (wick only), providing a strength score for each zone.

- MERGING LOGIC: Adjacent zones that overlap in price and are close in time are merged into broader, more meaningful zones.

- ZONE RE-ENTRY ALERTS: Optional alerts when price re-enters a previously detected zone, with configurable cooldown.

- AGE FADING: Zones gradually fade as they age, keeping focus on recent, relevant areas.

- CONFIGURABLE LOOKBACK: Choose between bar-based or hour-based lookback periods.

- STRENGTH FILTERING: Filter out weak zones based on minimum strength score.

- CUSTOMIZABLE VISUALS: Zone color, fill opacity, border thickness, label position, and extension right bars.


--------------------------------------------------


PARAMETER GUIDE


SETTINGS


Minimum Consecutive Candles: The minimum number of candles that must overlap consistently to form a zone. Higher values produce larger, more significant zones. Lower values produce smaller zones. Default is 6.


Max Dissenting Candles: The maximum number of non-overlapping candles allowed within the sequence. A value of 0 requires perfect consecutive overlap. Higher values allow some gaps. Default is 1.


Overlap Tolerance (Pips): The tolerance in pips for considering a candle as overlapping the zone. Default is 3.0. Increase this for wider zones on volatile pairs. Decrease for tighter zones.


Lookback Mode: Choose between Bars and Hours for the lookback period. Bars mode uses a fixed number of candles. Hours mode calculates the number of candles based on the chart timeframe.


Lookback Period (Bars): The number of bars to scan for zones. Default is 100. Increase for longer-term zones on higher timeframes. Decrease for focus on recent activity on lower timeframes.


Lookback Hours: The number of hours to scan for zones. Default is 24. Use with Hours mode.


Merge Adjacent Zones: When enabled, zones that overlap in price and are close in time are merged. Default is true.


Merge Bar Proximity: The maximum number of bars between zones to consider them for merging. Default is 3.


Merge Pip Proximity: The maximum price distance in pips to consider zones for merging. Default is 3.0.


Minimum Zone Width (Pips): The minimum width a zone must have to be displayed. Default is 0.1. Increase to filter out extremely narrow zones.


Max Zone Age (Bars): The maximum age of a zone in bars. Zones older than this are removed. Default is 0 (off).


HEATMAP


Heatmap Style: Choose between Off, MultiColor, or SingleColor. MultiColor uses the full spectrum from blue to red. SingleColor uses variations of the selected zone color.


Min Band Width (Pips): The minimum width of individual heatmap bands. Default is 0.1.


Min Heatmap Candle Count: The minimum number of candles that must overlap a band for it to be displayed. Default is 4. Increase to show only the most active bands.


STRENGTH SCORING


Body Weight: The weight assigned to body-in-zone candles in the strength score. Default is 2.0. Higher values prioritize candles with body inside the zone.


Wick Weight: The weight assigned to wick-only candles in the strength score. Default is 1.0. Lower values reduce the importance of wick-only touches.


Minimum Strength Score: The minimum strength score required for a zone to be displayed. Default is 0 (off). Increase to filter out weak zones.


VISUALS


Fill Opacity Percent: The opacity of the zone fill. Default is 50 percent.


Color Intensity Percent: The intensity of the zone colors. Default is 120 percent.


Enable Age Fading: When enabled, zones fade as they age. Default is false.


Show Core Border: When enabled, a border is drawn around the zone. Default is true.


Border Thickness: The thickness of the zone border. Default is 1.


Zone Color: The color used for zones when heatmap is off or in SingleColor mode. Default is Gold.


Show Label: When enabled, a label is shown on each zone. Default is false.


Show Strength In Label: When enabled, the strength score is shown in the label. Default is false.


Label Position: Position of the label on the zone: Top, Center, or Bottom. Default is Center.


Label Color: The color of the zone label. Default is White.


Extend Right Bars: The number of bars to extend the zone to the right. Default is 0.


ALERTS


Alert on Zone Re-Entry: When enabled, alerts are triggered when price re-enters a zone. Default is false.


Alert Cooldown (Bars): The minimum number of bars between alerts for the same zone. Default is 5.


--------------------------------------------------


USE CASES


- Identify consolidation zones for breakout or mean-reversion strategies

- Use body-in-zone vs wick-only scoring to assess zone quality

- Heatmap reveals the most active price levels within each zone

- Zone re-entry alerts capture retests of key levels

- Use with trend indicators to filter zones by market direction

- Place stops above or below high-quality consolidation zones


--------------------------------------------------


RECOMMENDED WORKFLOW


Step 1: Attach the indicator to your chart with default settings.

Step 2: Identify zones with high strength scores and high body-in-zone ratios.

Step 3: Examine the heatmap to see where price activity is concentrated.

Step 4: Use zones as potential support/resistance levels for entries and exits.

Step 5: Enable alerts for zone re-entry to catch retests.


--------------------------------------------------


PRACTICAL EXAMPLE


On a EURUSD H1 chart, the indicator detects a consolidation zone between 1.0850 and 1.0875 with 10 consecutive candles. The zone has 8 body-in-zone candles and 2 wick-only candles, giving a strength score of 18 (8*2 + 2*1).


The heatmap shows concentrated activity between 1.0860 and 1.0870 (red band), indicating where price has spent the most time. This becomes your focus area for entries.


When price breaks above the zone and later retests it, the re-entry alert triggers, providing a potential second-entry opportunity.


--------------------------------------------------


TECHNICAL NOTES


- Overlay indicator (draws on price chart)

- Works on any timeframe and symbol

- Configurable lookback (bars or hours)

- No repainting; calculations are historical

- Optimized for performance

- Compatible with cTrader


--------------------------------------------------


SUPPORT


Lifetime updates included.


FOR MORE INFORMATION - Click Developer's Profile below.

Ringkasan

Profil indikator
Kategori indikator
Support & resistance
Tipe output
Visualisasi
Sinyal
Filter
Persyaratan data
Hanya batang
Sinyal yang didukung
Level tertembus
Level tersentuh
Reversal
Breakout
Kekuatan tren
Volatilitas

Ulasan pelanggan

0.0
Ulasan: 0
Ulasan pelanggan
Belum ada ulasan untuk produk ini. Sudah mencobanya? Jadilah pemberi ulasan pertama!

Diskusi

Pertanyaan umum

Flag
Key Levels
BOS
Order Block
Market Structure
Liquidity Grab
Support & Resistance
Produk-produk yang tersedia melalui cTrader Store, termasuk bot trading, indikator, dan plugin, disediakan oleh pengembang pihak ketiga serta hanya ditujukan untuk akses teknis dan informasi. cTrader Store bukan broker dan tidak menyediakan saran investasi, rekomendasi pribadi, atau jaminan apa pun tentang kinerja di masa mendatang.

Produk lain dari penulis ini

Indikator
ATR
RSI
+5
Free swing detector with Fibonacci retracement and RSI overlay. Auto-deviation adapts to any timeframe
Indikator
Volume
Imbalance
+1
Volume profile indicator that auto-detects the latest trendline. Shows POC, Value Area (VAH/VAL), and High Volume Nodes
Indikator
ATR
RSI
+4
VWAP with ATR ribbon bands and RSI labels on completed breakouts — live forming labels on cTrader.
Indikator
EMA
Channel
+3
Real-time squeeze detection, dual-horizon trend scoring & institutional breakout validation HUD dashboard.
Indikator
ATR
BOS
+5
Auto Swing detection with regular and hidden divergence analysis. RSI and MACD divergence detection.
Indikator
ATR
RSI
+5
Multi-factor VWAP mean-reversion signals with ATR bands, volume exhaustion, and RSI gate on cTrader.
Indikator
MSS
Volume
+3
Rejection-based volume profile with tiered heat zones, POC levels and a fully draggable anchor on cTrader.
cBot
ATR
Wedge
+5
15 YEARS RESULTS :Win rate:93% | ROI+19000% | Trades:87,000 | Profit Factor 1.2 | Currency Pairs:22 | $10k to 500k$ |
1.2
Faktor laba
Indikator
MSS
VWAP
+5
VWAP mean-reversion signals combined with a ribbon-anchored volume profile, VAH/VAL, POC and HVN levels.
Indikator
ATR
BOS
+5
Heat intensity mapping of structural participation. See where price fights, where it accepts, and where it rejects .
Indikator
RSI
Volume
+3
Auto-detects swings, Includes POC, Value Area (VAH/VAL), High Volume Nodes (HVN), Fibonacci retracement, and RSI overlay
Indikator
ATR
EMA
+5
Multi-factor volatility squeeze detector, dual-trend scoring & breakout validation dashboard. No repaint.

Anda mungkin juga suka

Indikator
ATR
Fibonacci
+1
Trading Clock Pro: An all-in-one market timing dashboard designed to help traders understand the market at one Spot.
Indikator
Key Levels
Supertrend
+1
A cTrader indicator for clear trend direction, entry timing, and on-chart risk visualization.
Indikator
SMC
VWAP
+5
Most advanced Volume Profile Pivot Box indicator — auto pivots, volume zones, smart candle coloring & SMC trading tool.
Indikator
ATR
Key Levels
+1
See both sides of the trade before you take either one.
Indikator
Volume
Channel
+3
A higher-timeframe log-regression channel with a volume profile, Point of Control and session levels.
Indikator
EMA
SMA
+5
Trend Blueprint All-in-One Trend & Structure
Indikator
Area of Interest with the power of AI to detect the market interest.
Indikator
Forex
Crypto
+5
Experience a new approach with amplitude-based momentum analysis. Smart Trend Detection That Adapts to Market Volatility
Indikator
BOS
CHOCH
+2
The full SMC suite: structure BOS CHoCH MSS , FVG, liquidity, order blocks & a 0 to100 confluence score. No repaint.
Indikator
SMC
Pro Volume Profile with Delta, Session Filters & CSV Export. Precision order flow analysis.
Indikator
ATR
Volume
+2
Heatmap Liquidity Zones Visualize volume-at-price, uncover hidden support/resistance, and track market liquidity in real
Indikator
SMC
Forex
+5
Silver Bullet by LudwigICT
Indikator
AI
SMC
+4
Weekly Daily Opening Gaps — NWOG & NDOG Indicator Professional-grade opening gap visualization for institutional traders
Indikator
Key Levels
Liquidity Sweep
+2
Complete intraday market structure tool tracking session killzones, Asian range projections, and PDH/PDL levels.
Indikator
Prop
Forex
+11
🌊 See when the market is truly in play. Tsunami measures Relative Volume by time-of-day 🌊
Indikator
RSI
VWAP
+5
Turtle Soup ICT Strategy – Detect liquidity traps & trade smart money moves with precision on cTrader.
Logo "E7 BBKG Indicator"
Peringkat teratas
4.5
(4)
$25
/
$50
Indikator
Prop
E7 BBKG indicator with 80% plus accuracy used to show both, possible reversal and trend.
Indikator
Signal
Stocks
+5
🚀 Automated Elliott Wave & Fibonacci tool for cTrader. Spot trends, corrections & retracements fast.

Harga

Sejak 14/01/2025
2
Penjualan
165
Instal gratis