
Descrição
KUMO FORGE PRO
Um sistema Ichimoku cujos períodos se adaptam à volatilidade, com cada sinal avaliado em uma escala de 100 antes de ser
desenhado.
O QUE ELE COLOCA NO SEU GRÁFICO
A imagem completa do Ichimoku - Tenkan-Sen, Kijun-Sen, a nuvem Kumo e o Chikou span - com uma
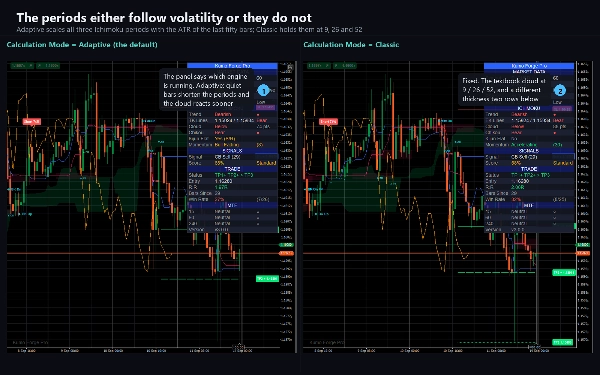
diferença em relação à versão do livro didático: no modo Adaptativo, os três períodos se estendem e comprimem com
a volatilidade medida, então a nuvem reage mais rápido em um mercado rápido e mais devagar em um mercado calmo. O modo clássico
oferece os fixos 9 / 26 / 52 se você preferir.
Além disso:
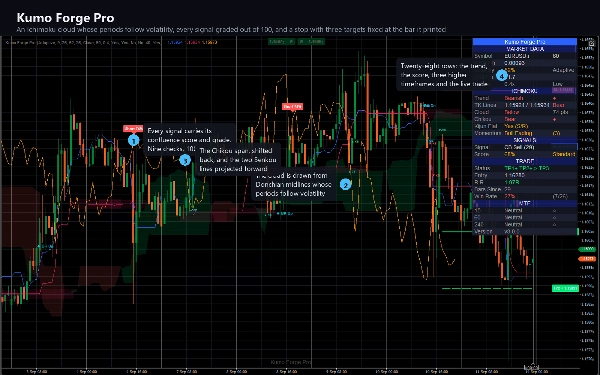
- Placas de sinal indicando Long ou Short com a pontuação de confluência nelas.
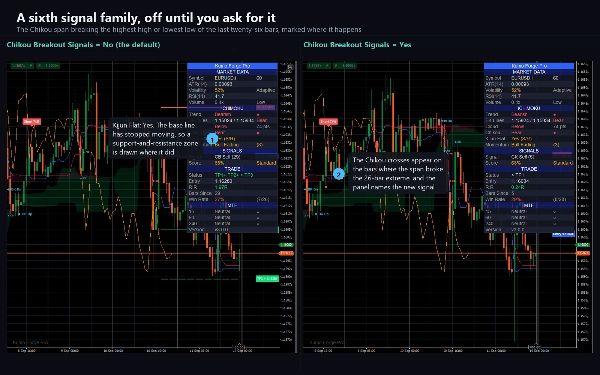
- Marcadores de rompimento e reteste da Kumo, marcadores de bounce no Kijun e na borda da nuvem, e marcadores de rompimento do Chikou.
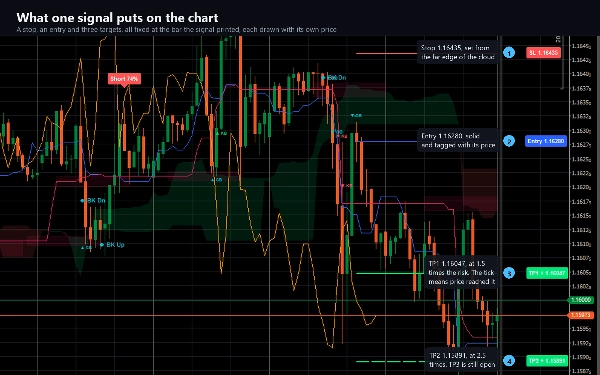
- Um desenho completo de trade após cada sinal: a entrada, um stop e três níveis de take-profit, cada um uma
linha rotulada com seu próprio preço.
- Zonas de suporte e resistência desenhadas onde quer que o Kijun-Sen fique plano.
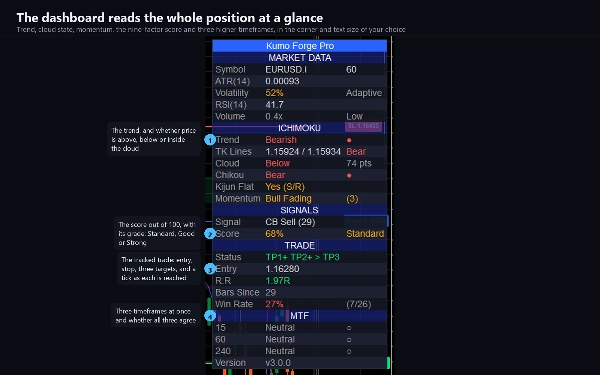
- Um painel com até 28 linhas: ATR, volatilidade, RSI, volume, tendência, os valores das duas linhas, estado e
espessura da nuvem, Chikou, momentum, o sinal e sua nota, o status do trade ao vivo, R:R, e um
painel de alinhamento em três timeframes.
COMO FUNCIONA A PONTUAÇÃO
Nove fatores, cada um valendo um número fixo de pontos: preço em relação à nuvem (20), as duas linhas alinhadas
(15), concordância do Chikou (15), direção da nuvem (10), espessura da nuvem (8), volume (10), momentum (12),
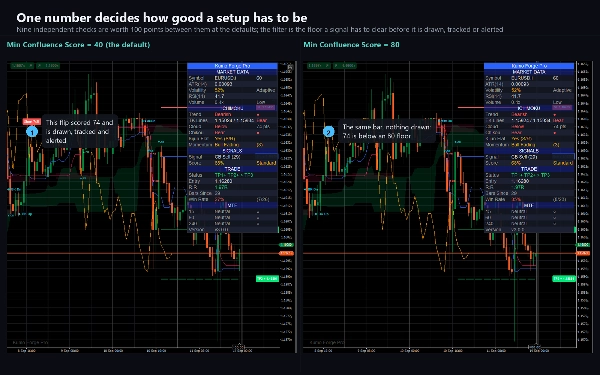
aceleração do momentum (10), e opcionalmente RSI (10). Um sinal deve atingir a Pontuação Mínima de Confluência - 40 de
100 por padrão - antes de ser desenhado. Aumente para menos e melhores sinais; diminua para mais.
Dois dos nove não dependem da direção, então uma nuvem fina com baixo volume reduz tanto a pontuação de alta quanto a de baixa,
e nada dispara em nenhuma direção. Isso é intencional: é o mercado dizendo
que não há nada ali.
CINCO TIPOS DE SINAL, TODOS EM BARRAS FECHADAS
1. Cruzamento Tenkan/Kijun, o gatilho clássico, com a pontuação na placa.
2. Bounce no Kijun - o preço cai até a linha base e fecha acima dela em uma tendência de alta.
3. Bounce na borda da nuvem - a mesma ideia contra o limite da nuvem.
4. Rompimento da Kumo, com requisito de volume, mais um marcador de reteste quando o preço retorna à borda rompida.
5. Rompimento do Chikou, a confirmação mais atrasada, desligada por padrão.
Cada sinal é avaliado em uma barra fechada e nunca se move depois que essa barra fecha.
O MOTOR INTELIGENTE DE TP/SL
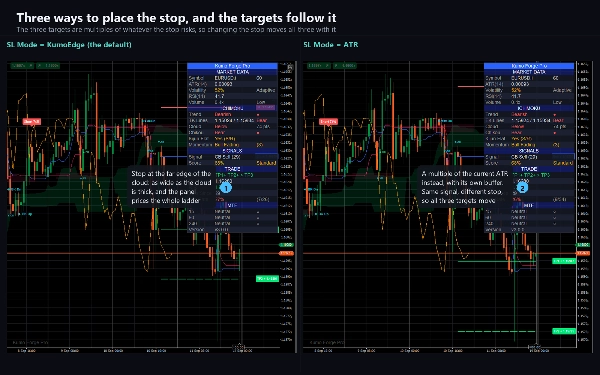
Após cada sinal, ele desenha uma entrada, um stop e três alvos. O stop vem da borda da nuvem mais próxima,
da linha Kijun, ou de um múltiplo direto do ATR - sua escolha - e os três alvos são múltiplos de risco
dele, 1.5R, 2.5R e 4R por padrão. O painel acompanha quais foram alcançados e mostra o
R:R ao vivo da ideia aberta.
O PAINEL MULTI-TIMEFRAME
Três timeframes - M15, H1 e H4 por padrão, quaisquer três que você preferir - cada um reportando alta, baixa ou
neutro do mesmo teste Ichimoku, além de indicar se os três concordam. Uma linha de timeframe superior se confirma quando
a barra desse timeframe fecha.
ALERTAS
Vinte e três eventos em treze interruptores: ambos os cruzamentos, ambos os rompimentos, ambos os retestes, ambos os bounces no Kijun,
ambos os bounces na nuvem, ambos os rompimentos do Chikou, cada um dos três alvos, o stop, os dois eventos de alinhamento,
as três mudanças de tendência e os dois eventos de sinal forte. Cada um vai para o log do cTrader, um som
e um e-mail, com um corpo JSON disponível para qualquer coisa que leia seu log.
CONFIGURAÇÕES PRINCIPAIS
O modo de cálculo escolhe Adaptativo ou Clássico. Os três períodos Ichimoku e o deslocamento são todos
ajustáveis. A Pontuação Mínima de Confluência é o único controle que altera quanto ele desenha. O modo SL e os três
múltiplos R:R moldam o desenho do trade. Cada elemento visual tem seu próprio interruptor, o painel tem quatro
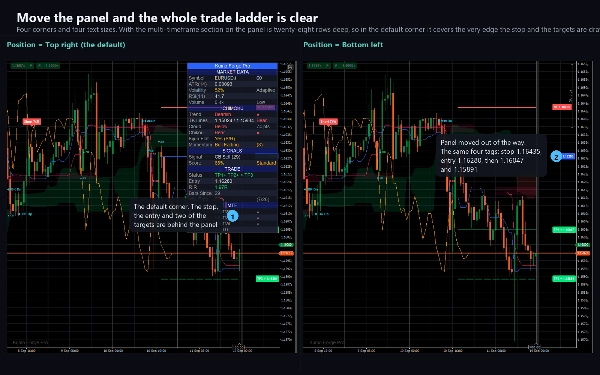
posições e quatro tamanhos de texto, e todas as seis cores são suas.
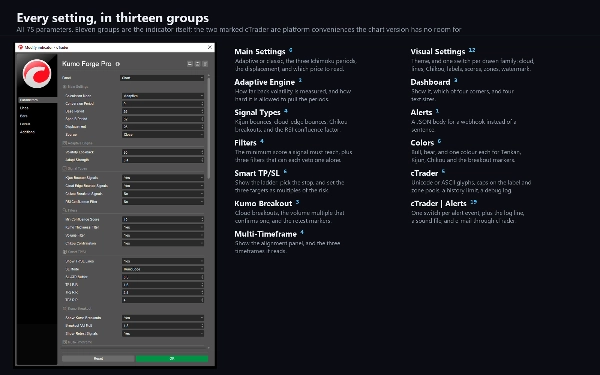
Setenta e cinco parâmetros no total, todos documentados, com padrões que funcionam no primeiro gráfico em que você
o colocar.
TIPO DE INDICADOR E JANELA
Um indicador sobreposto: ele desenha no gráfico de preços, não em um painel separado. Ele lê apenas barras e volume de ticks.
TIMEFRAMES E INSTRUMENTOS PREFERIDOS
M15 a H1 é onde os períodos 9 / 26 / 52 foram projetados para funcionar e onde o conjunto multi-timeframe padrão
se encaixa naturalmente acima do gráfico. H4 e D1 dão sinais menos frequentes e mais lentos com nuvens mais largas. M1 e M5
funcionam, mas produzem muitos mais sinais - aumente a Pontuação Mínima de Confluência primeiro.
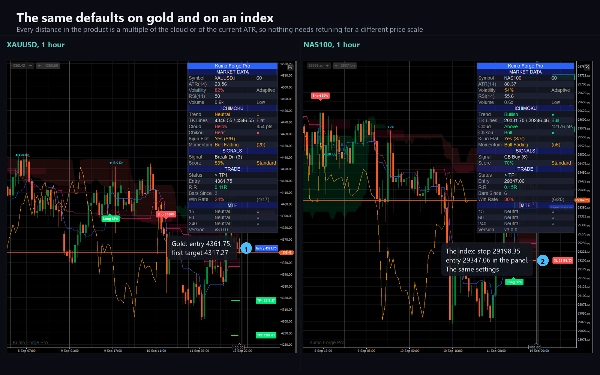
Construído e verificado no EURUSD; a lógica é independente do símbolo e é usada em pares forex principais e menores,
ouro e prata, índices, petróleo e criptomoedas. O filtro de volume precisa de um símbolo cujo feed contenha volume de ticks, o que forex e CFDs possuem.
PARA QUEM É
Traders que já leem Ichimoku e querem que a nuvem acompanhe um mercado em mudança, a aritmética de confluência feita para eles,
e os níveis de trade desenhados em vez de medidos manualmente. É adequado para swing e
trading intradiário em M15 e acima.
O QUE NÃO É
Não é um sistema automatizado. Não faz ordens, não abre conexão de rede e não lê arquivos -
não declara nenhum direito de acesso, o que você pode verificar nos detalhes do algoritmo.
A VERSÃO DE TESTE
A versão de teste é o mesmo produto restrito ao EURUSD, com qualquer sufixo de corretora aceito. Não há limite de tempo
e nada é retido: todos os cinco tipos de sinal, todos os quatro filtros, o motor completo de TP/SL, as
zonas, o painel, o dashboard, todos os 23 alertas e todos os 75 parâmetros. A versão completa adiciona todos os outros
símbolos.
NOTAS TÉCNICAS
cTrader Desktop 5.x. Os sinais não repintam. As cinco linhas de trade são redesenhadas a cada barra para que continuem
atingindo a borda direita, e as linhas multi-timeframe se confirmam quando sua própria barra fecha - ambos são
documentados no pacote. O cTrader mostra uma margem direita apenas com o Chart Shift ativado, então as etiquetas de preço
ficam fixadas logo dentro da borda direita.
SUPORTE
Através da aba Discussão nesta página. Por favor, inclua sua corretora, símbolo, timeframe, versão do cTrader
e uma captura de tela do gráfico completo incluindo o painel.
Negociar envolve riscos. Desempenho passado não garante resultados futuros.
Resumo
The indicator displays the full Ichimoku components—Tenkan-Sen, Kijun-Sen, Kumo cloud, and Chikou span—enhanced with nine-factor confluence scoring to evaluate signals out of 100 before plotting. It supports five signal types on closed bars: Tenkan/Kijun cross, Kijun bounce, cloud-edge bounce, Kumo breakout with retest, and Chikou breakout (optional).
Kumo Forge Pro automatically draws trade setups including entry, stop loss (configurable via cloud edge, Kijun line, or ATR), and three take-profit levels based on risk multiples. It also marks support/resistance zones where Kijun-Sen is flat.
A multi-timeframe panel displays Ichimoku signals across three user-selectable timeframes, indicating bullish, bearish, or neutral trends and their alignment. The dashboard provides up to 28 data rows covering volatility, momentum, volume, trend, and live trade status.
The indicator supports symbols with tick volume data, including major and minor forex pairs, metals, indices, oil, and crypto. It does not automate trading or place orders but offers extensive alerts and customization with 75 parameters.