"Daily Open Color Zones Pro_noSourceCode" logo
Daily Open Color Zones Pro_noSourceCode
"Daily Open Color Zones Pro_noSourceCode" uploaded image
Since 13/09/2025
20
Sales
3.89K
Free installs

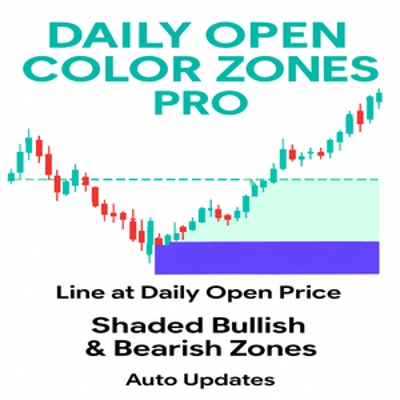
This indicator is a professional tool designed to plot the Daily Open Line and instantly shade the bullish and bearish price zones around it. Instead of leaving traders guessing, it delivers a clear visual map of market sentiment from the very first of the day. Its goal: to help you instantly identify whether the market is trading above or below the daily open — a key reference point for intraday strategies.

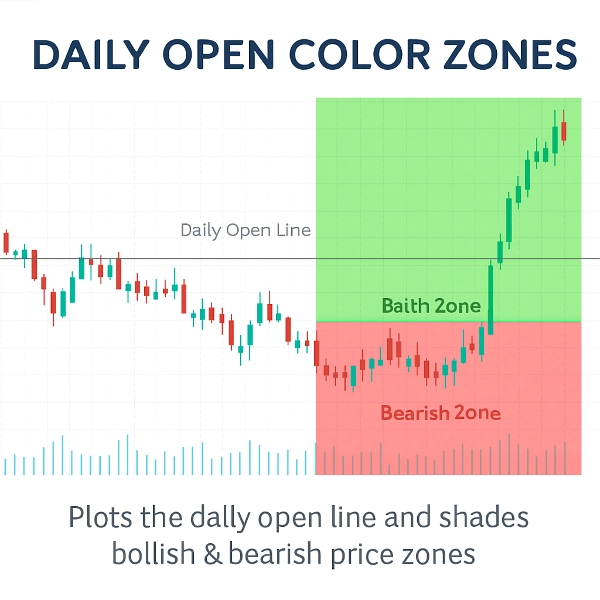
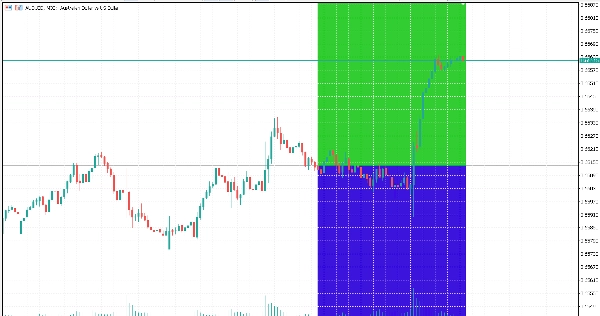
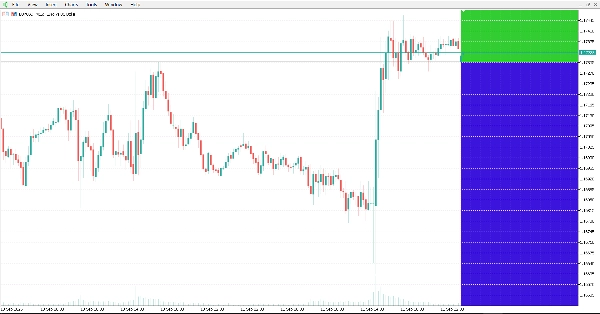
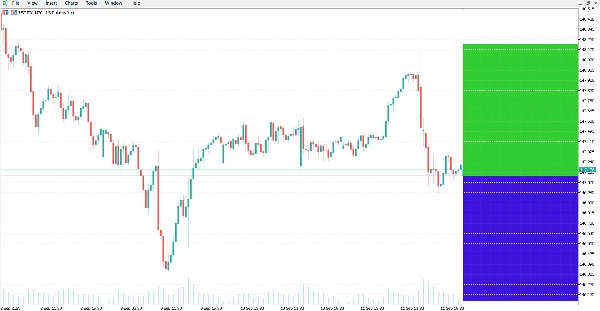
The indicator automatically draws a horizontal line at the daily open price and shades the chart:

Green Zone above the line for bullish territory.

Red Zone below the line for bearish territory.

This simple yet powerful visual cue helps traders quickly assess bias, spot potential reversals, and align trades with the prevailing market direction.

Features

Automatic Daily Open Line: Plots the exact daily open price with precision.

Clear Color Zones: Instantly distinguish bullish and bearish areas with customizable colors and transparency.

Dynamic Updates: Zones adjust automatically with each new candle and chart zoom.

Customizable Appearance: Change line style, thickness, and zone colors to match your chart theme.

Lightweight & Fast: Optimized for minimal CPU usage, even on live accounts with large datasets.

Works on All Symbols & Timeframes: From forex to commodities, indices, and crypto.

Why Use It? The daily open is one of the most watched price levels by professional traders. By visually separating bullish and bearish zones, this indicator gives you an instant read on market sentiment, helping you make faster and more confident trading decisions.

Conclusion This is not just a line on your chart — it’s a visual trading edge. Whether you scalp, day trade, or swing trade, the Daily Open Color Zones indicator will keep you anchored to one of the most important price levels of the day.


Indicator profile
0.0
Reviews: 0
Customer reviews
No reviews for this product yet. Already tried it? Be the first to tell others!
Scalping
Products available through cTrader Store, including trading bots, indicators and plugins, are provided by third-party developers and made available for informational and technical access purposes only. cTrader Store is not a broker and does not provide investment advice, personal recommendations or any guarantee of future performance.

More from this author

SuperTrend X cBot is a fully automated trading robot for cTrader built entirely on the power of the SuperTrend indicator
Signal Strike is a professional trading indicator delivers clear, high‑confidence entry signals directly on your chart
Stop Loss Pro – Precision Risk Management for Every Trader
Gold Pulse Pro – An automated trading system for gold (XAUUSD) precisely engineered and powered by advanced algorithms
EMA 21 13 8 Scalper is a fully automated trading system that captures intraday momentum with clarity and discipline
Supertrend RSI ADX is a trading system built for traders who demand precision, control, and steady performance.
indicator showing the Daily Open Line and instantly shading bullish and bearish zones.
Perfect Entry Price designed to help traders identify the most accurate and reliable price levels for market entries
Download Ultimate Trend ADX today and experience a smarter way to track market trends completely free on ctrader
Final Moving Average is an adaptive system designed to keep traders aligned with the true direction of the market
Measure Market Strength at a Glance – Instantly
Gold Predict AI – Advanced Predictive Trading for XAUUSD (M15)

You may also like

JMA-like is a highly responsive and ultra-smooth moving average designed to replicate the behavior of the original JMA!
The Floating Risk Indicator is an essential tool for traders who prioritize risk management.
Regression channels with Fibonacci levels across multiple regression types, timeframes, and custom date ranges.
ReversalGuard Pro: Domina el Mercado con Zonas de Soporte y Resistencia de Alta Precisión"
📊 Automatically plots Fibonacci retracement and extension levels based on the most recent significant price movements.
Identify Trend Strength with Absolute Precision on cTrader
🎯 Identifies specific reversal patterns formed by exactly three consecutive candles.
Candle Timer & Strength DEMO for cTrader This is a DEMO version of the Candle Timer & Strength indicator. You can use al
🚨Detection of geometric price patterns (Harmonic Patterns) and market structures based on price action📈
A powerful overlay tool designed to automatically plot Fibonacci retracement levels based on a custom window.
Automatically plots Fibonacci retracement levels using the highest and lowest points of a customizable time range
Check the correlations between dozens of assets in one elegant display.
Smart Money traders, it extends key levels until mitigation, helping you track liquidity, structure
Pattern Detector With Signal Buy and Sell
Enhance your trading strategy with automated detection and alerts for key chart patterns.
Price Projection Swing Volume maps future paths using swing pivots and Fibonacci ratios. Visual, geometric and precise.!
Real-Time Candlestick Pattern Detection with Custom Alerts & Trend Analysis for cTrader
Volume distribution analysis with Market Profile TPO integration.
Since 13/09/2025
20
Sales
3.89K
Free installs