Description
Bounty Killa – the indicator that hunts stop-loss liquidity before the big players do.
Bounty Killa is a cTrader indicator designed for traders who love to trade stop hunts / liquidity grabs: those candles that spike above highs or below lows, clear out stops and then reverse in the opposite direction.
The indicator automatically scans every candle and flags:
- SHS (Stop Hunt High) – probable stop hunt above recent highs → area to look for short setups
- SHL (Stop Hunt Low) – probable stop hunt below recent lows → area to look for long setups
The detection logic is built around:
- breaking recent highs/lows by at least X pips,
- a long wick extending beyond that level,
- a small body and a close in the opposite direction of the breakout.
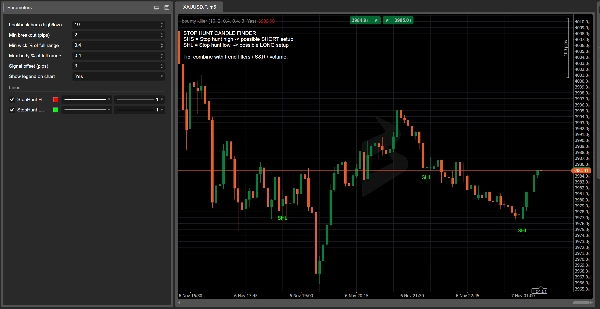
No more guessing “maybe this was a stop hunt”: Bounty Killer highlights the key candles directly on your chart, with clear labels, colors and an on-chart legend.
Why traders like it:
- Shows where the market may have grabbed liquidity and where a reversal becomes more meaningful.
- Fully customisable: lookback window, minimum breakout in pips, body/wick percentages, signal offset.
- Combines perfectly with classical support/resistance, supply & demand, volume, order blocks and SMC concepts.
- Great for traders who follow liquidity-based setups but want something objective and rule-based instead of pure eyeballing.
⚠️ Bounty Killa is not a full trading system and does not open or close trades.
The marked candles are high-information zones that should be integrated with your own strategy, trend analysis and risk management.
Bounty Killa – Quick User Guide (EN)
1. Recommended markets & timeframes
- Timeframes: H1, H4, D1
(Lower TF like M1–M5 = a lot of noise, use mainly for study.) - Symbols: indices, FX, crypto, stocks, commodities – anywhere you can attach a cTrader indicator.
2. How to read the signals
- SHS – Stop Hunt High (red label above the candle)
- Price spikes above recent highs, creates a long upper wick, and closes bearish.
- Idea: potential short setup after a fake breakout and liquidity grab above highs.
- SHL – Stop Hunt Low (green label below the candle)
- Price spikes below recent lows, creates a long lower wick, and closes bullish.
- Idea: potential long setup after a fake breakdown and liquidity grab below lows.
Bounty Killer does not say “buy/sell now”.
It highlights liquidity zones where a reversal makes more sense.
3. Suggested base settings
In the indicator parameters:
- Lookback bars (high/low):
10–20
→ how many bars to look back for recent highs/lows. - Min breakout (pips):
5–15pips
→ minimum distance beyond the high/low to count as a stop hunt. - Min wick % of full range:
0.60–0.70
→ at least 60–70% of the candle must be wick in the stop-hunt direction. - Max body % of full range:
0.25–0.35
→ small body compared to the total candle range. - Signal offset (pips):
3–5
→ visual only, moves the SHS/SHL label slightly away from the candle.
4. Simple example strategy
Trend filter (EMA 200):
- Add a 200 EMA to your chart.
- Shorts only:
- Price below EMA 200
- You get an SHS signal (stop hunt high).
- Longs only:
- Price above EMA 200
- You get an SHL signal (stop hunt low).
Entry idea:
- Wait for the stop-hunt candle to close.
- Enter on the next candle only if price confirms:
- For SHS: next candle breaks the low of the SHS candle → consider a short.
- For SHL: next candle breaks the high of the SHL candle → consider a long.
Stop loss:
- For SHS (short) → SL just above the high of the SHS candle.
- For SHL (long) → SL just below the low of the SHL candle.
Take profit:
- Aim for at least 1:1.5 or 1:2 R/R, or
- Use nearby swing highs/lows, support/resistance or supply/demand zones as targets.
5. Safety notes & quick checklist
Before using a Bounty Killer signal, ask:
- Trend?
Is the signal aligned with the overall trend (EMA 200 / market structure)? - Level?
Is the stop hunt happening at a meaningful level (previous high/low, S/R, session high/low, etc.)? - Context?
Any news, session open/close, volatility spikes? - Risk?
Is your stop size ok for your money management (max % per trade)?
If 3–4 of these points line up, the SHS/SHL from Bounty Killa is not just “a nice candle”, but a high-value zone to build a trade idea around.
Summary
The detection criteria include a breakout beyond recent highs/lows by a configurable number of pips, a long wick extending beyond that level, a small candle body, and a close opposite to the breakout direction. Signals are displayed directly on the chart with clear labels and colors, supported by an on-chart legend.
Recommended for use on hourly to daily timeframes (H1, H4, D1) across various markets including forex, indices, cryptocurrencies, stocks, and commodities, Bounty Killa is fully customizable with parameters such as lookback period, minimum breakout size, wick and body proportions, and signal label offset.
The indicator highlights high-value liquidity zones to support trading decisions but does not execute trades. It is intended to be combined with other analysis tools like support/resistance, volume, order blocks, and trend filters (e.g., 200 EMA) for developing objective, rule-based liquidity-based trading setups.
Customer reviews
5 | 50 % | |
4 | 50 % | |
3 | 0 % | |
2 | 0 % | |
1 | 0 % |


