"Regression Channel" logo
Regression Channel
"Regression Channel" uploaded image
Since 20/12/2024
5.57K
Free installs

Transform price chaos into clear trend channels with precision regression mathematics.


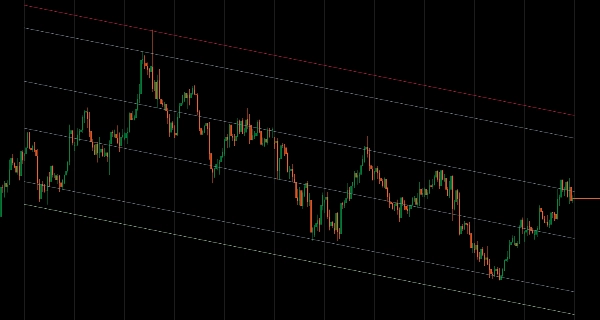
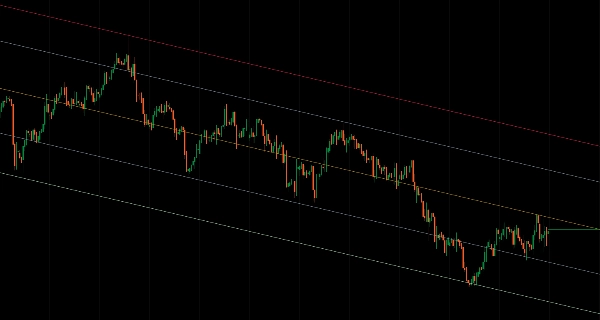
Regression Channel calculates a linear regression line through your selected price data and draws upper/lower boundaries based on price deviations - giving you a statistically-grounded view of trend direction and potential reversal zones.


Perfect For

  • Structure traders seeking objective trend definition
  • Mean reversion traders identifying overbought/oversold extremes
  • Breakout traders spotting channel violations and momentum shifts
  • Multi-timeframe analysis - plot monthly regression on daily charts for context


Key Features

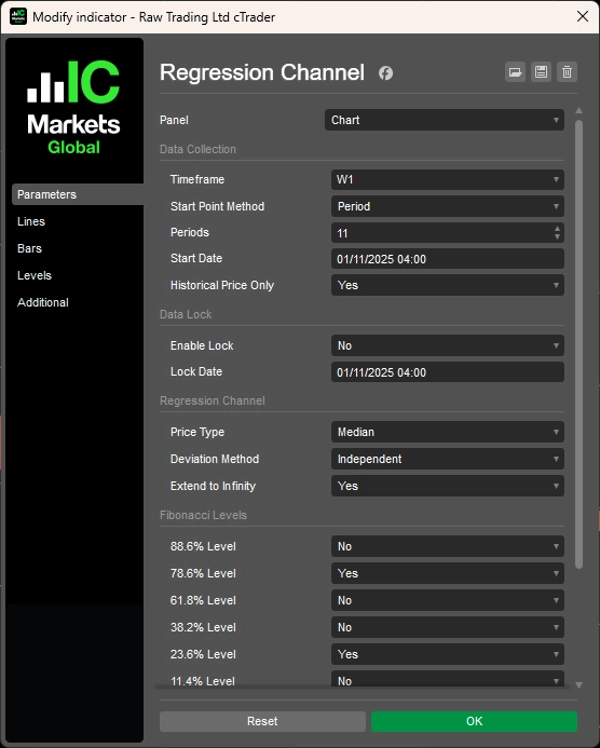
  • Flexible Data Selection
    • Period Mode: Analyze last N bars (e.g., last 12 monthly candles)
    • DateTime Mode: Start from specific market events or dates
    • Lock Mechanism: Freeze analysis at a historical point while price continues
    • Multi-Timeframe: Draw regression from any timeframe on your current chart
  • Smart Deviation Methods
    • Average: Balanced levels using mean deviations (ideal for trading zones)
    • Independent: Asymmetric channels that adapt to directional volatility
    • Maximum: Shows extreme price boundaries for full range analysis
  • Professional Tools
    • 6 Fibonacci retracement levels (11.4%, 23.6%, 38.2%, 61.8%, 78.6%, 88.6%)
    • 6 price types: Open, High, Low, Close, Median, Typical
    • Historical-only mode: Exclude forming bars for stable backtesting
    • Extend to infinity option for long-term projections
    • Full color customization


Why It Stands Out

Unlike basic regression tools, this indicator gives you control. Lock your analysis to study how price behaved after a specific event. Switch between symmetric and asymmetric channels. Combine higher timeframe structure with lower timeframe execution - all with clean, efficient code built for reliability.


Clean charts. Clear structure. Confident decisions.

Indicator profile
0.0
Reviews: 0
Customer reviews
No reviews for this product yet. Already tried it? Be the first to tell others!
Fibonacci
Products available through cTrader Store, including trading bots, indicators and plugins, are provided by third-party developers and made available for informational and technical access purposes only. cTrader Store is not a broker and does not provide investment advice, personal recommendations or any guarantee of future performance.

More from this author

Customizable VWAP with flexible reset, three band methods, and full Fibonacci level control.
Detect FVGs with age, status, Fibonacci levels, and customizable fill threshold—extended version.
Clear pivot levels. Clean S/R zones. Five methods. Any timeframe.
Volume distribution analysis with Market Profile TPO integration.
Custom and native timeframes display with OHLC lines, moving averages, and Fibonacci levels.
VSA indicator analyzing volume, spread, and close location to detect supply/demand imbalances.
Track Initial Balance ranges across any period with optional Fibonacci levels and projections.
Plots automatic psychological levels at round-number zones – major structure & liquidity levels.
Statistically-grounded trend channels via linear regression — clear trend & reversal zones.
28-method MA library in one indicator — from classic EMAs to adaptive & zero-lag variants.
John Ehlers' trendline using signal processing to filter cycle noise and identify trends with minimal lag.
Complete MA-channel system: colored trend, channel boundaries & equilibrium with 6 Fib zones.

You may also like

ALGO-XL — PHANTOM CHANNEL ORACLE (Elite buy & Sell engine)
TMA Bands Essentials – Advanced Mean Reversion Tool
SUPER TREND Oscillatore
Automatically detects and marks higher highs, lower highs, lower lows and higher lows.Check the other version in my page
Market Sentiment Pro: Predict tops & bottoms using crowd psychology. Contrarian signals with 70-80% accuracy. Early Acce
CandleTimer ticking remaining time.
Indicator calculates spread in pips
Auto Trend Line Indicator for cTrader
⚡ ADXVMA Aurora Trend Filter combines ADX trend strength with an adaptive EMA blend ⚡
Daily TPO profile indicator that calculates POC, VAH and VAL for each session. Plots the Point of Control and the 70% Va
Pivot-based Support and Resistance levels that extend until broken, with volume-confirmed break signals
Identify potential reversal points in the market by detecting candles with exceptionally long upper or lower wicks
Market Profile TPO – Advanced Auction Market Analysis for cTrader
Upgrade to ATR-RMA! Experience the precise ATR using Relative Moving Average for accurate volatility analysis in cTrader
Anchored VWAP Buttons
Show each Market Session with full details, including grid mode for higher timeframes, statistics, and other metrics.
Powerful all-in-one tool for traders seeking a clear, dynamic view of market structure. By merging pivots, trendlines &
Session Volume Profile is a professional volume profile indicator for cTrader.
Since 20/12/2024
5.57K
Free installs