Brokers & props
For business
00
Days
:
00
Hours
:
00
Minutes
:
00
Seconds
Indicator
NAS100
NZDUSD
Martingale
Forex
Fibonacci
EURUSD
MACD
BTCUSD
SMC
Indices
ATR
Stocks
Grid
RSI
Breakout
XAUUSD
FVG
Commodities
Signal
Bollinger
GBPUSD
AI
VWAP
ZigZag
Prop
Supertrend
Crypto
USDJPY
Scalping
Kalman Filter Trend
16/01/2026
Desktop
Since 04/03/2025
Traded volume
37.38M
Pips won
6.03M
Sales
55
Free installs
2974
"Kalman Filter Trend" uploaded image

📌 Kalman Filter Trend – Overview & Review

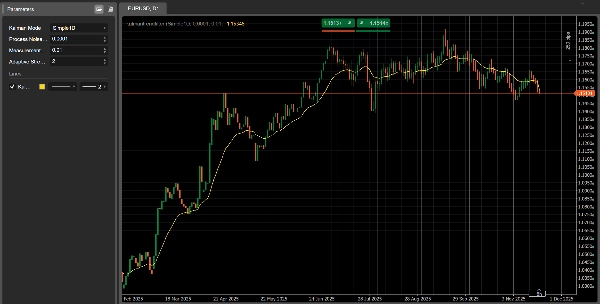
Kalman Filter Trend is an advanced trend-following indicator for cTrader, designed to deliver a smooth, highly responsive trend line with significantly less lag than traditional moving averages.

Where classic SMA/EMA filters react slowly and often miss early trend changes, the Kalman Filter:

  • Continuously updates its estimate of “true” price
  • Balances smoothness and responsiveness mathematically
  • Adapts to volatility (Adaptive mode)
  • Models both price and velocity (2D mode)

This makes it a powerful tool for both manual traders and automated system developers.


🎛 Modes & Parameters

Kalman Mode (3 Versions in One Indicator)

1️⃣ Simple1D

A classic 1D Kalman filter.
Fast, clean, and excellent for short-term trend detection.

2️⃣ PositionVelocity2D

Models both price and trend velocity.
Ideal as a directional filter in algorithmic strategies.

3️⃣ Adaptive1D

Automatically adjusts to volatility.
More reactive in fast markets, smoother in quiet conditions.


🧩 Key Parameters Explained

  • Process Noise (Q):
    Higher = faster trend reaction, lower = smoother line.
  • Measurement Noise (R):
    Higher = filter trusts data less → smoother result.
  • Adaptive Strength:
    Used only in Adaptive1D. Controls how strongly volatility affects the filter.


📈 How to Interpret Signals

1. Detecting Trend Direction

  • Uptrend: Line sloping upward, price holding above the filter.
  • Downtrend: Line sloping downward, price holding below the filter.
  • Flat: Market is ranging, avoid breakout strategies.


2. Entry Signals (Crossover Logic)

Bullish Entry:

  • Price closes above the Kalman line
  • The line starts turning upward

Bearish Entry:

  • Price closes below the Kalman line
  • The line starts turning downward


3. Trend Strength (2D Mode)

The slope becomes a direct reading of momentum:

  • Strong upward slope → strong bullish trend
  • Strong downward slope → strong bearish trend
  • Flattening slope → trend weakening or transition phase


📊 Practical Usage Examples

✔ Trend-Follow Strategy

Use Simple1D or Adaptive1D:

  • Buy above the line when slope turns positive
  • Sell below the line when slope turns negative

✔ Multi-Timeframe Approach

  • Use Kalman on H1 for direction
  • Use Kalman on M15 for precision entries
  • Enter only in the direction indicated by the higher timeframe

✔ Bot Integration

Perfect for algorithmic trading:

  • Allow only long if slope > 0
  • Allow only short if slope < 0
  • Use Adaptive1D for volatile indices like US500, NAS100, US2000


🌟 Join Our Community

If you want access to:

  • Exclusive optimizations for each of our bots
  • Advanced configuration tips
  • Trading improvements
  • Personalized technical help
  • Updates and new tools

👉 Join our community by clicking the link on my profile page.
There you will find the best optimization settings for all our bots, updated regularly.

0.0
Reviews: 0
Customer reviews
No reviews for this product yet. Already tried it? Be the first to tell others!
More from this author
Indicator
NAS100
NZDUSD
Martingale
+26
Volume Delta
Read aggressive flow in real time. Flexible resets (Day/Week/Month), optional EMA smoothing, and non-repainting cumulati
cBot
NAS100
NZDUSD
Martingale
+26
Prop Ready Bot_v.2.0
The Prop-Ready Bot The Definitive Automaton for Challenges 🛡️ V2.0
Indicator
Grid
NZDUSD
XAUUSD
+16
vWAP Free
Editions: Free (core VWAP + bands) · Pro (multi‑VWAP, click‑to‑anchor, alerts).
cBot
Grid
NAS100
RSI
+20
Breakout Premium Pro v2.0
A price-action-first algorithm to trade Breakout, Approach, and Return around prior High/Low levels—with Prop-style risk
cBot
NAS100
NZDUSD
Martingale
+26
ElliottWaveBot
N.B.: Results with an initial invested capital of 100 euros.
cBot
NAS100
NZDUSD
Martingale
+26
ElliottWave Pro cBot
The Elliott Wave Pro Bot is a sophisticated and highly configurable algorithmic trading system
Indicator
NAS100
NZDUSD
Martingale
+26
Breakout channel
Breakout Channels automatically detects consolidation ranges and highlights when price breaks out of them.
cBot
NAS100
NZDUSD
Martingale
+26
TradeCopierBot
✅ Buy 3 prop accounts and manage just 1: cut management effort by 66% with a professional tool.
Indicator
NAS100
NZDUSD
Martingale
+26
Volume Bubble
Volume Bubbles is a lightweight yet powerful visual indicator for cTrader
Indicator
ZigZag
Indices
Breakout
+1
Auto Tools Suite
Auto Trendlines, Fibonacci, Pitchfork and Patterns from non‑repainting pivots. One‑click Presets, targeted Alerts, and a
Indicator
NAS100
NZDUSD
XAUUSD
+14
ZIG ZAG Free
ZigZag Free is a clean swing-detection tool that marks significant pivot highs/lows
cBot
NAS100
NZDUSD
Martingale
+26
Dynamic Trendline Deluxe Pro Cbot - PROP edition
Major Update Announcement: Advanced Prop Firm Risk Management is Here! 🚀
Indicator
NAS100
NZDUSD
Martingale
+26
Liquidity Shift Indicator
Want a cBot based on this indicator? Contact us!
cBot
NAS100
Indices
XAUUSD
+7
COT Institutional Sentiment Bot
Institutional COT sentiment, automated position trading and full prop-firm style risk control – all in one cBot.
Indicator
Grid
NAS100
NZDUSD
+15
EMA UP&DOWN 2025
SectorIndex Dual Moving Average Indicator: Your Market Compass 🧭
cBot
Indices
ATR
US500 LONG&SHORT TF 5M ALL SEASON!
🚀N.B.: Results with an initial invested capital of 100 euros.
Indicator
NAS100
NZDUSD
Martingale
+25
Volume Profile Suite trial7D
DEMO VERSION 7 DAYS VolumeProfileSuite is an advanced and flexible Volume Profile indicator for cTrader.
cBot
Indices
RSI
Forex
+2
US 2000+MACD+ADR+ADMIR+RSI+MANY MORE-TF4M
N.B.: Results with an initial invested capital of 100 euros.
You may also like
Indicator
Grid
RSI
Breakout
+12
Trend Pulse X
is a trend-following indicator designed to provide a clear view of market direction, momentum, and strength
Indicator
Signal
Supertrend
SuperTrend Scanner
Supertrend Scanner – Track trends across assets & timeframes in real-time with alerts. Stay ahead, and trade smarter!
Indicator
Bollinger
Repiptor BB Width
Bollinger Bands Width
Indicator
NAS100
Indices
XAUUSD
+2
AlgoCorner DonchianPSAR
Visualize market asymmetry like never before — steady climbs meet sudden drops with the Donchian PSAR
Indicator
NAS100
XAUUSD
FVG
+11
Fair Value Gaps_FVG_MTF
Multi-TF FVG + Smart Fibonacci
Indicator
Indices
Prop
Breakout
+4
Pivot Points Daily Session
Pivot Point with base zone daily Asia-London-New york Session.
Simple MACD Histogram
Simple MACD Histogram with color-coded rising (green) and falling (red) momentum bars.
Indicator
Indices
Prop
Stocks
+6
New Way Sar - Pro
The Parabolic SAR, or "Stop and Reverse," is a dynamic technical analysis tool
VegaXLR - RSI and StochRSI Alerts
VegaXLR's cTrader StochRSI identifies overbought/oversold RSI levels for precise trade entries.
Indicator
RSI
Breakout
XAUUSD
+6
Multi-Asset Performance Matrix
Visual tool tracking financial assets' % performance across timeframes, highlighting trends with color-coded insights.
CandleColourFlow_MultiFx
CandleColourFlow MultiFx - optimized to work on Fx Majors, Fx MInors, Fx Crosses
Indicator
VWAP
Indices
Prop
+4
Volume Weighted Average Price
VWAP is a powerful tool for intraday traders
Indicator
Indices
RSI
Breakout
+9
Advanced HTF Trend Buy & Sell Trading System
Detects breakouts 📈 auto-draws levels 🚀 confirms trends 🐻 dynamic signals 🎨 customizable for any asset & timeframe.
Indicator
Scalping
Kaufman Adaptive MA with Trend Vision
Adaptive KAMA: fast in trend, slow in noise — with color-coded market state visualization.
Top-rated
Free
BarSentiments
This Indicator is a technical analysis tool that measures the strength and direction of market sentiment
Indicator
NAS100
NZDUSD
Martingale
+26
Dynamic Trend Flux
Dynamic Trend Flux is a colored momentum oscillator based on the classic fast/slow EMA difference plus a signal line.
Indicator
NAS100
NZDUSD
Martingale
+26
Skew Volatility Bias Indicator
Trade with the hidden edge — identify bullish and bearish dominance instantly
Clarosti
Clarosti a chave para decisões inteligentes no mercado