MACDVolume
Indicator
18 purchases
Version 1.0, Dec 2024
Windows, Mac
5.0
Reviews: 3

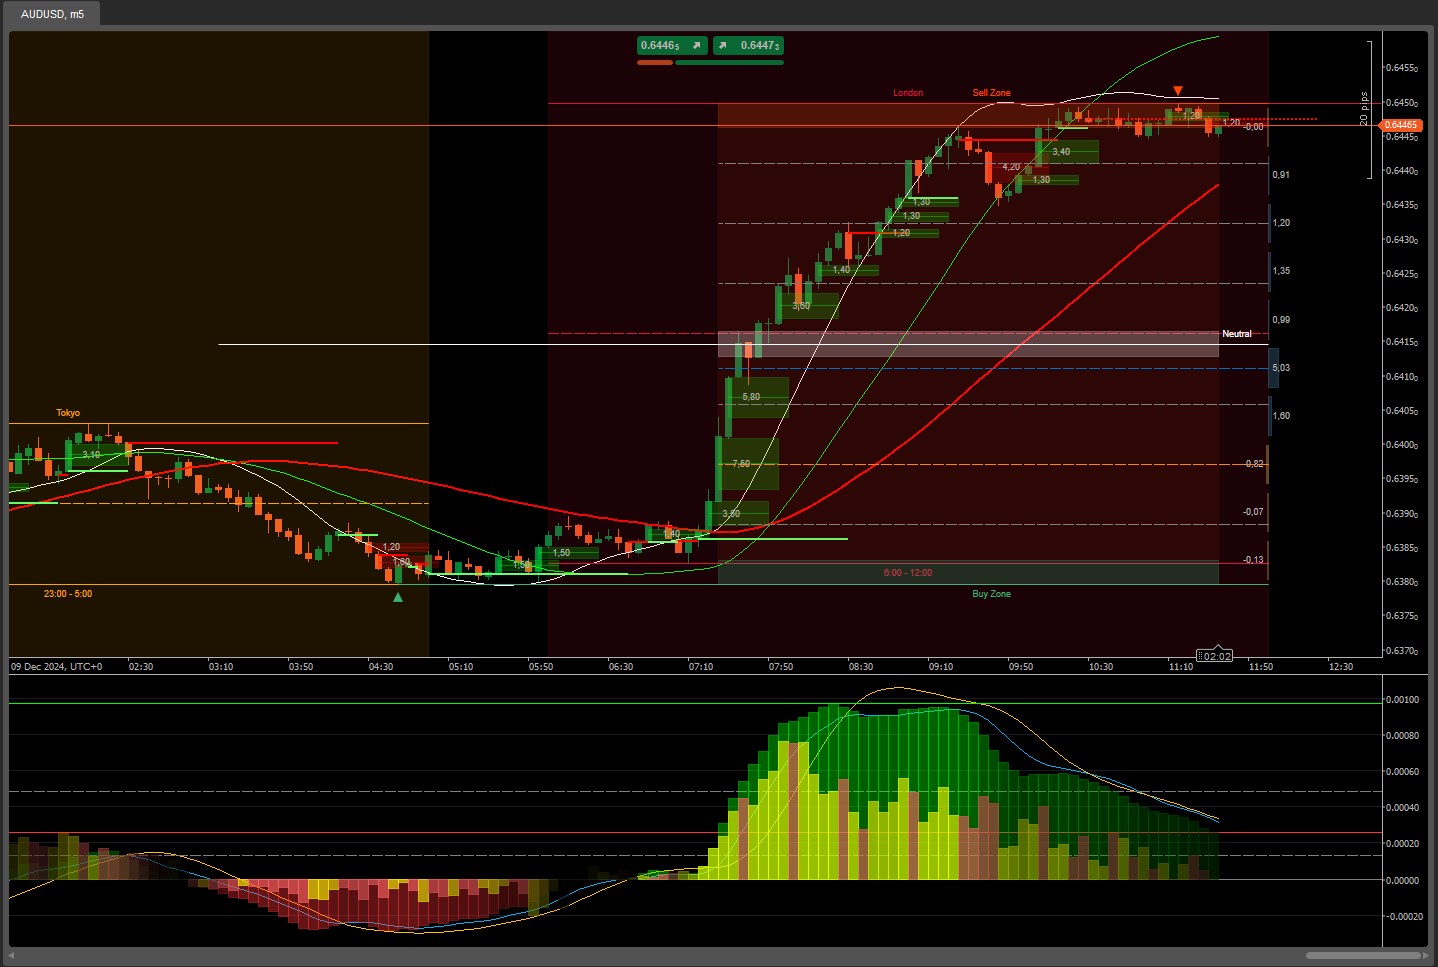
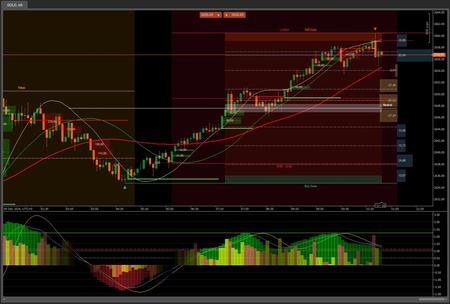
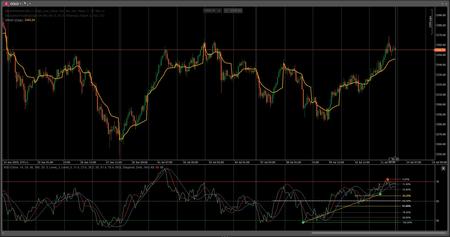
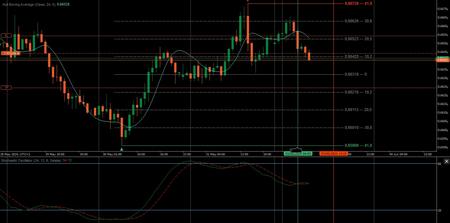
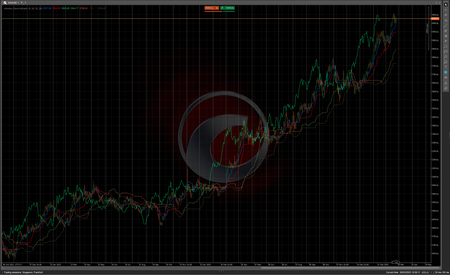
Advanced MACD Indicator with Dynamic Color Change and Volume
Description: Our Advanced MACD Indicator is not just a simple histogram. This indicator is designed to provide a clear and dynamic view of market trends, with unique features that make it indispensable for any serious trader.
Key Features:
- Dynamic Color Change:
- Positive: The histogram changes from green to white as values increase, providing a clear visualization of bullish trends.
- Negative: The histogram changes from red to white as values decrease, highlighting bearish trends.
- Volume Indicator:
- Positive Volume: Represented by green bars, indicating an increase in trading volume.
- Negative Volume: Represented by red bars, indicating a decrease in trading volume.
- Clear Visualization: The combination of colors in the volume bars (green, yellow, brown, red) provides a clear view of market buying and selling activity.
- Auto Zoom:
- Keeps the indicator centered and automatically adjusted for optimal viewing, without the need for constant manual adjustments.
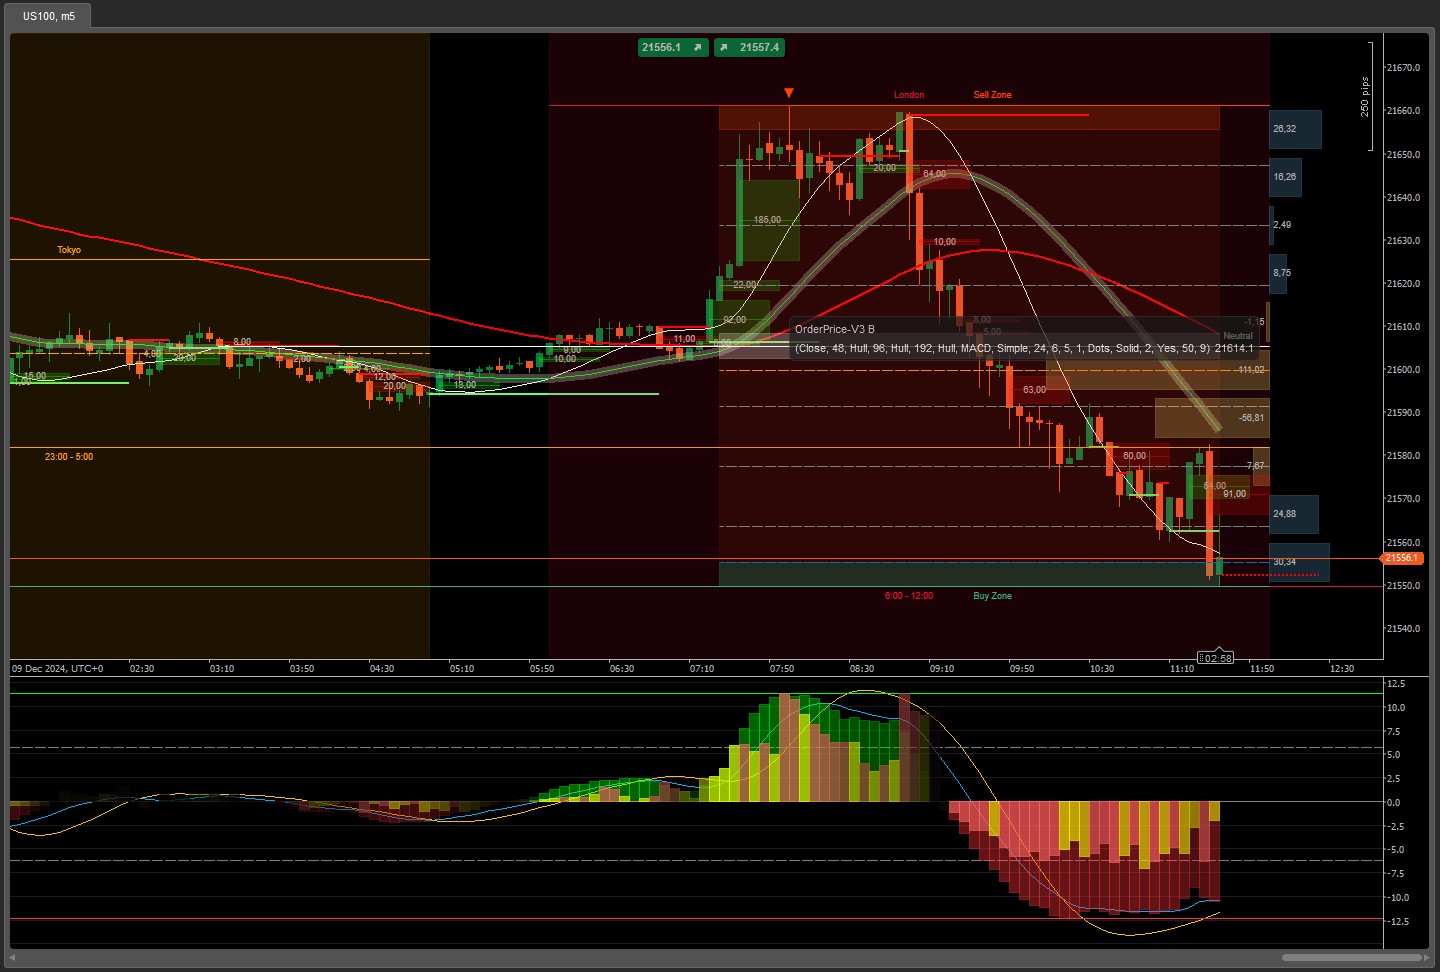
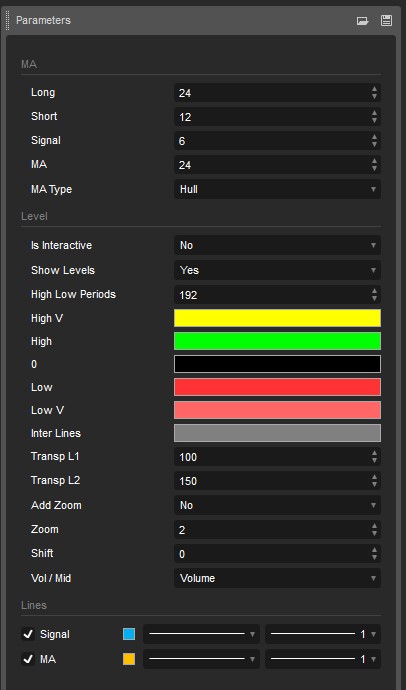
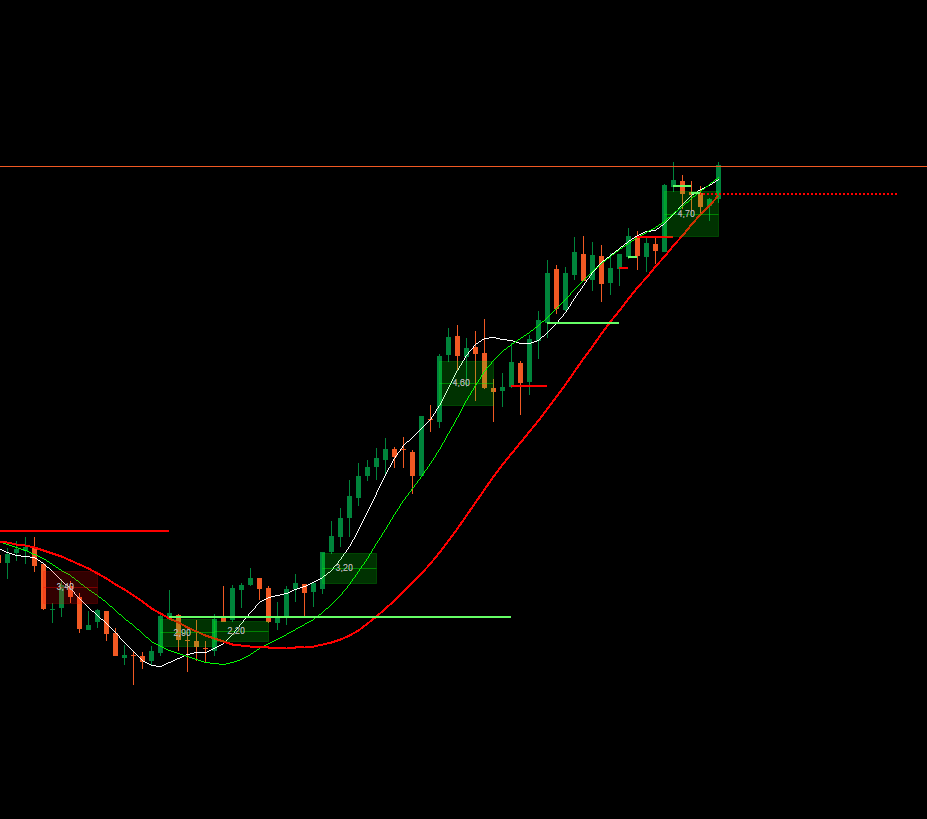
- Customizable Moving Average:
- Incorporates an additional moving average that you can select from the available options, allowing for greater customization and adaptation to your trading strategy.
- Highs and Lows:
- Displays the highest and lowest levels in the selected period, providing a clear view of market extremes.
Benefits:
- Visual Clarity: Dynamic color changes make it easy to identify trends and turning points in the market.
- Customization: The ability to select different moving averages and adjust color levels allows you to tailor the indicator to your specific needs.
- Efficiency: Auto zoom ensures you always have the best view of the indicator without the need for manual adjustments.
- Comprehensive Analysis: Including volume and high/low levels provides a more complete view of the market.
Ideal For:
- Traders looking for an advanced and customizable tool to enhance their technical analysis.
- Those who want a clear and dynamic visualization of market trends.
- Users who value efficiency and customization in their trading tools.
With additional tools like
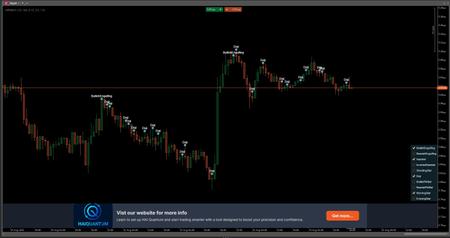
OrderPrice V3 https://ctrader.com/products/397
NTMPICLL https://ctrader.com/products/327
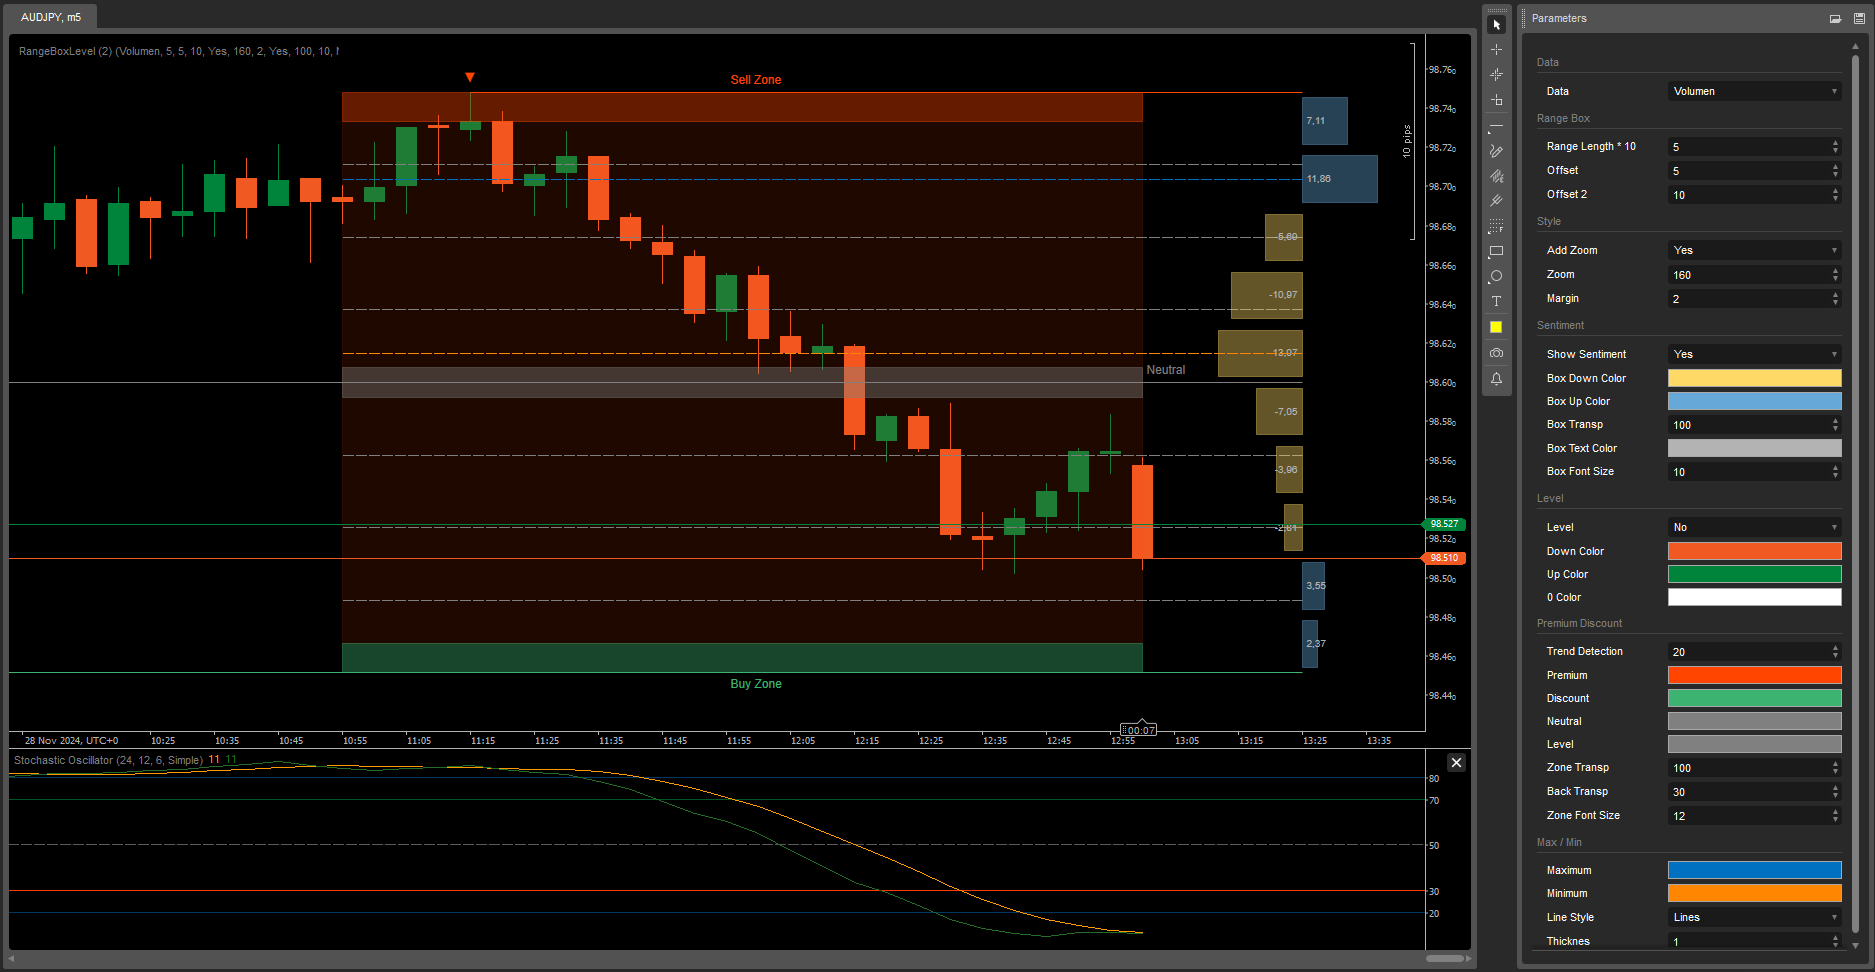
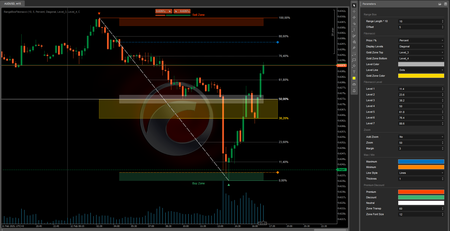
Range Box Level https://ctrader.com/products/245
Or RangeBoxFibonacci https://ctrader.com/products/526
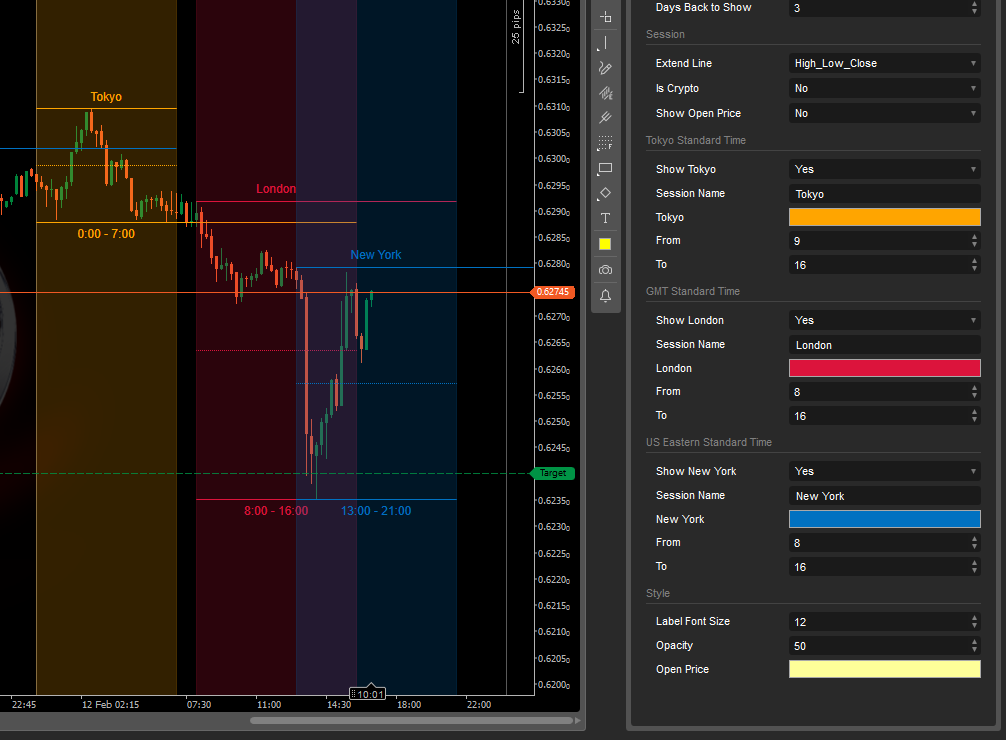
Market Session https://ctrader.com/products/525
MacdVolume https://ctrader.com/products/267
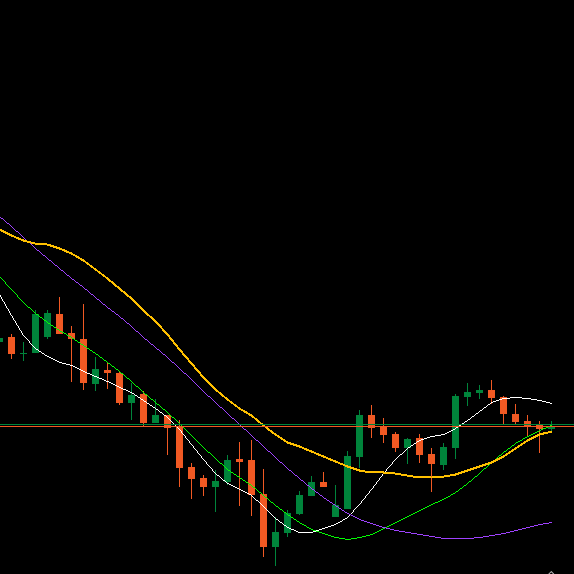
4MA https://ctrader.com/products/247
You will be invincible
Good luck 😀
5.0
Reviews: 3
5 | 100 % | |
4 | 0 % | |
3 | 0 % | |
2 | 0 % | |
1 | 0 % |
Customer reviews
January 12, 2026
August 28, 2025
MACDVolume is a strong complementary tool for traders already using MACD. It enhances decision-making by incorporating volume, making signals more trustworthy.
April 17, 2025
Stocks
Forex
MACD
More from this author


You may also like
.png)


.png)
132
Sales
10.24K
Free installs