present
ลงทะเบียนและรับส่วนลด $50 สำหรับการซื้อครั้งแรกของคุณ
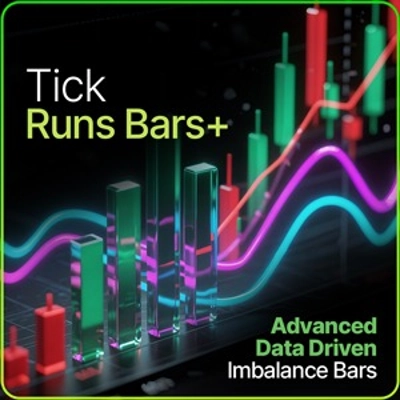
Trading product for WT - Tick Run Bars อินดิเคเตอร์ BTCUSD Forex, image 1
WT - Tick Run Bars
อินดิเคเตอร์
เวอร์ชัน 1.0, Nov 2025
Windows, Mac
Trading product for WT - Tick Run Bars อินดิเคเตอร์ BTCUSD Forex, image 2
Trading product for WT - Tick Run Bars อินดิเคเตอร์ BTCUSD Forex, image 3
99.81M
ปริมาณการเทรด
150.07K
Pips ที่ได้กำไร
96
การขาย
524
ติดตั้งฟรี

คำอธิบาย

TRB — ตัวบ่งชี้ Tick Runs Bars

ตรวจจับข้อมูลตลาดก่อนที่ราคาจะเคลื่อนไหว

ราคาพิเศษช่วงแนะนำสำหรับผู้เริ่มต้น - จองสำเนาของคุณตอนนี้ในราคาลดพิเศษก่อนที่ราคาจะปรับขึ้นเป็นราคาขายปลีกมาตรฐานเมื่อสิ้นสุดช่วงเปิดตัวแรก


เวอร์ชัน 1.1
ใช้ส่วนความคิดเห็นเพื่อขอรายละเอียดเพิ่มเติม
มีให้สำหรับเซสชันวิดีโอพร้อมคู่มือการตั้งค่าหลังการซื้อ


ตัวบ่งชี้ TICK RUNS BARS (TRB)

Tick Runs Bars ขยายการวิเคราะห์โครงสร้างตลาดระดับจุลภาคโดยการตรวจจับความต่อเนื่องในทิศทางของการไหลของการซื้อขาย นอกจากนี้ยังมีรากฐานมาจาก Marcos López de Prado's Advances in Financial Machine Learning ตัวบ่งชี้นี้ระบุเมื่อแรงกดดันตลาดด้านเดียวเบี่ยงเบนจากระดับที่คาดไว้ — เผยให้เห็นการแบ่งคำสั่งซื้อของสถาบันและกิจกรรมการซื้อขายที่ประสานงานกัน

ข้อมูลเชิงลึกหลัก

ผู้ซื้อขายสถาบันดำเนินการคำสั่งซื้อขนาดใหญ่เชิงกลยุทธ์ — พวกเขาจะแบ่งคำสั่งเหล่านั้นเป็นชิ้นเล็ก ๆ ซ่อนปริมาณเบื้องหลังคำสั่ง iceberg หรือใช้การดำเนินการด้วยอัลกอริทึมเพื่อหลีกเลี่ยงการเคลื่อนไหวของตลาด กลยุทธ์เหล่านี้ทิ้งลายนิ้วมือที่ชัดเจนในรูปแบบของการวิ่งซื้อขายในทิศทางเดียวอย่างต่อเนื่อง Tick Runs Bars ตรวจจับรูปแบบเหล่านี้โดยการวัดระยะเวลาที่ฝ่ายใดฝ่ายหนึ่งครอบงำการไหลของคำสั่ง เผยให้เห็นเมื่อมีการสั่งซื้อที่จงใจและรุนแรงเกิดขึ้นแทนที่จะเป็นความผันผวนของราคาแบบสุ่ม

วิธีการทำงาน

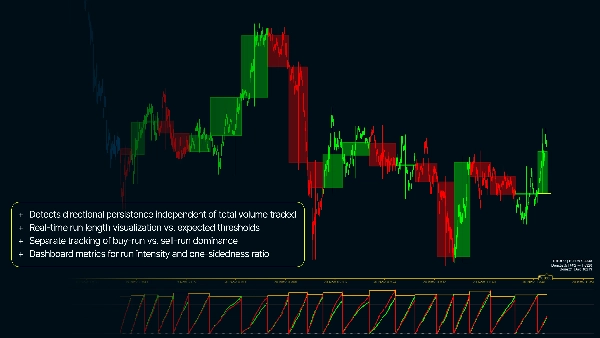
ตัวบ่งชี้คำนวณความยาวของปริมาณการวิ่งซื้อและการวิ่งขายแยกกัน — ไม่ได้นำมาหักล้างกันเหมือนเมตริกความไม่สมดุลแบบดั้งเดิม มันติดตามการสะสมปริมาณด้านเดียวสูงสุด (θT) เทียบกับเกณฑ์ที่คาดหวังแบบไดนามิกซึ่งได้มาจากความน่าจะเป็นการซื้อ/ขายในอดีตและปริมาณเฉลี่ย เมื่อการวิ่งในทิศทางจริงเกินความคาดหมาย แท่ง TRB ใหม่จะถูกกระตุ้น นี่เผยให้เห็น "รูปร่างโครงสร้าง" ของการดำเนินการไหลของคำสั่ง — ลายเซ็นของผู้เล่นสถาบันที่กำลังทำงาน

คุณสมบัติหลัก

  • ตรวจจับความต่อเนื่องในทิศทางโดยไม่ขึ้นกับปริมาณรวมที่ซื้อขาย
  • แสดงภาพความยาวการวิ่งแบบเรียลไทม์เทียบกับเกณฑ์ที่คาดหวัง
  • ติดตามแยกกันระหว่างการครอบงำการวิ่งซื้อและการวิ่งขาย
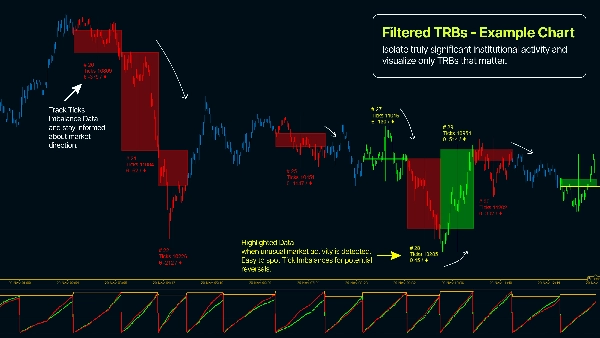
  • ระบายสีแท่งเทียนในแผนภูมิตามสมาชิก TRB แสดงช่วงของการดำเนินการคำสั่ง
  • ตัวกรองปริมาณขั้นต่ำเพื่อแยกกิจกรรมสถาบันที่มีความสำคัญจริง
  • เมตริกแดชบอร์ดสำหรับความเข้มข้นของการวิ่งและอัตราส่วนด้านเดียว
  • พารามิเตอร์ขนาดแท่งที่คาดหวังและ EWMA ที่ปรับได้ตามความผันผวนของเครื่องมือ

ทำไมต้องใช้ Tick Runs Bars?

  • ระบุการดำเนินการคำสั่งของสถาบันแบบเรียลไทม์ — ก่อนเสร็จสิ้น
  • ตรวจจับสภาพคล่องที่ซ่อนอยู่และรูปแบบคำสั่ง iceberg ผ่านการวิเคราะห์การไหล
  • แยกแยะการซื้อขายที่ประสานงานจากเสียงรบกวนตลาดแบบสุ่ม
  • จับการเคลื่อนไหวของราคาจากความไม่สมดุลของคำสั่งเชิงโครงสร้าง ไม่ใช่แค่ความผิดปกติทางสถิติ
  • จับเวลาการเข้า/ออกในช่วงเวลาที่มีการเข้าร่วมของสถาบันที่รู้จัก
  • ใช้ทฤษฎีโครงสร้างตลาดขั้นสูงเพื่อได้เปรียบในกรอบเวลาที่เร็วขึ้น
  • ลดสัญญาณเท็จจากการพุ่งขึ้นของการซื้อขายรายย่อยเล็กน้อย

สรุป

AI summary
WT - Tick Run Bars (TRB) is an indicator designed for market microstructure analysis that detects directional persistence in trading flow. It identifies when one-sided market pressure exceeds expected levels, revealing institutional order execution tactics such as order slicing, iceberg orders, and coordinated trading activity. The indicator separately measures the length of buy-run and sell-run volumes, comparing them to dynamic thresholds based on historical probabilities and average volumes. When these directional runs surpass expectations, a new TRB bar is generated, highlighting phases of aggressive order flow.

Key features include real-time visualization of run lengths versus expected thresholds, separate tracking of buy and sell dominance, candle coloring by TRB membership to indicate order execution phases, and a minimum volume filter to focus on significant institutional activity. The indicator also provides dashboard metrics for run intensity and one-sidedness ratio, with configurable parameters adapted to instrument volatility.

TRB supports analysis across various markets and symbols, including Forex, stocks, commodities, indices, and cryptocurrencies such as BTCUSD, EURUSD, GBPUSD, and XAUUSD. It is intended to help traders identify institutional participation in real-time, detect hidden liquidity patterns, distinguish coordinated trading from noise, and time entries and exits during significant market activity.
โปรไฟล์อินดิเคเตอร์

รีวิวจากลูกค้า

0.0
รีวิว: 0
รีวิวจากลูกค้า
ยังไม่มีรีวิวสำหรับผลิตภัณฑ์นี้ หากเคยลองแล้ว ขอเชิญมาเป็นคนแรกที่บอกคนอื่น!

การสนทนา

คำถามที่พบบ่อย

BTCUSD
Forex
Signal
Breakout
Indices
EURUSD
Commodities
GBPUSD
NZDUSD
Prop
Scalping
Crypto
Stocks
XAUUSD
NAS100
USDJPY
ผลิตภัณฑ์ที่มีให้บริการผ่าน cTrader Store รวมถึงบอทการเทรด อินดิเคเตอร์ และปลั๊กอิน มีให้บริการโดยนักพัฒนาบุคคลที่สามและมีไว้เพื่อวัตถุประสงค์ในการเข้าถึงข้อมูลและทางเทคนิคเท่านั้น cTrader Store ไม่ใช่โบรกเกอร์และไม่ได้ให้คำแนะนำการลงทุน คำแนะนำส่วนบุคคล หรือการรับประกันผลการดำเนินงานในอนาคต

เพิ่มเติมจากผู้เขียนคนนี้

อินดิเคเตอร์
Prop
Forex
+12
Lightweight Risk-Reward Visualization Tool.
ปลั๊กอินเดสก์ท็อป
Forex
Crypto
+3
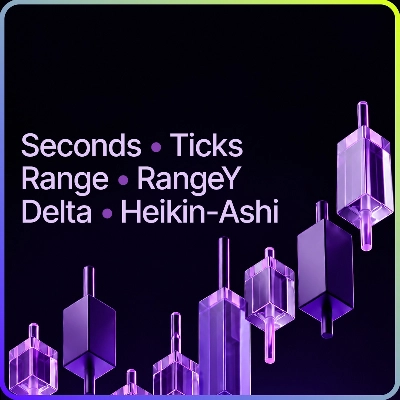
Seconds | Ticks | Range | RangeY | Delta | Heikin-Ashi Bar types. Any size or Symbol.
ปลั๊กอินเดสก์ท็อป
Stocks
Indices
+1
Build custom charts based on specific trading sessions.
cBot
Fixed Risk %
No Overtrading
+5
Turn Your Keyboard into a Trading Console — Instant Entries, Exits, and Precision Risk Control.
อินดิเคเตอร์
Forex
Crypto
+5
Experience a new approach with amplitude-based momentum analysis. Smart Trend Detection That Adapts to Market Volatility
อินดิเคเตอร์
Key Levels
Supertrend
+1
A trend-regime system for cTrader — spot the trend, the pullback zone and your stop in one glance.
"wt.Z-Trend" โลโก้
เรตติ้งสูง
4.5
(4)
จาก $9
อินดิเคเตอร์
Forex
Crypto
+5
This indicator combines two independent analytical engines into a single overlay on your chart.
ปลั๊กอินเดสก์ท็อป
Fixed Risk %
Risk/Reward
+5
⚡Trade faster. Manage easier. Stay within your risk.
ปลั๊กอินเดสก์ท็อป
Chart UI Tools
Trend Reversal (TRev) charts plot candlesticks according to the distance price moves, not the passage of time.
อินดิเคเตอร์
Imbalance
Order Block
+5
Spot the moments when price and order flow disagree - across every timeframe, at a glance.
อินดิเคเตอร์
ATR
Supertrend
+5
Read price differently. Measure what the market actually does.

นอกจากนี้คุณยังอาจชอบ

"HeatmapLiquidityZones" โลโก้
ยอดนิยม
5.0
(2)
$35
/
$45
อินดิเคเตอร์
ATR
Volume
+2
Heatmap Liquidity Zones Visualize volume-at-price, uncover hidden support/resistance, and track market liquidity in real
"Zigzag Trend" โลโก้
เรตติ้งสูง
4.5
(4)
$25
/
$45
อินดิเคเตอร์
AI
ATR
+23
The ZigZag Trend is a market structure tool that filters out small price fluctuations and highlights major swing.
"Turtle Soup ICT Strategy " โลโก้
ยอดนิยม
4.6
(3)
$49
อินดิเคเตอร์
RSI
VWAP
+5
Turtle Soup ICT Strategy – Detect liquidity traps & trade smart money moves with precision on cTrader.
อินดิเคเตอร์
MSS
Volume
+3
Rejection-based volume profile with tiered heat zones, POC levels and a fully draggable anchor on cTrader.
อินดิเคเตอร์
Grid
Prop
+5
Logarithmic Framework by LudwigICT
อินดิเคเตอร์
Imbalance
Key Levels
+4
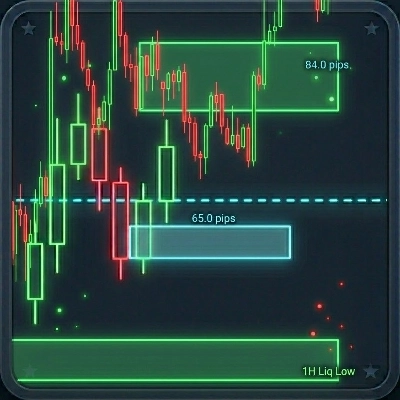
This indicator combines Multi-Timeframe Liquidity tracking, a dynamic Fair Value Gap (FVG) and a 50% Daily Range
"ZigXRay" โลโก้
เรตติ้งสูง
4.6
(5)
$29
/
$49
อินดิเคเตอร์
CHOCH
Key Levels
+5
ZigZag Market Structure Identifier - Multi-Layer Scanner: Convergent Pivot Detection, 4-TF Overlay & Naked Chart Mode.
"BSL_SSL_Liqudity" โลโก้
ยอดนิยม
4.3
(3)
$30
/
$50
อินดิเคเตอร์
Forex
BTCUSD
+5
Buy-Side & Sell-Side Liquidity (BSL/SSL) Indicator
อินดิเคเตอร์
AI
ATR
+27
The Fibonacci Automated Levels Indicator is a smart trading tool that automatically detects the most recent market.
อินดิเคเตอร์
Supertrend
Moving Average
Easy Trade: Trend & Breakout Indicator for cTrader
อินดิเคเตอร์
Area of Interest with the power of AI to detect the market interest.
อินดิเคเตอร์
ATR
RSI
+5
Multi-factor VWAP mean-reversion signals with ATR bands, volume exhaustion, and RSI gate on cTrader.
อินดิเคเตอร์
SMC
Forex
+5
Detects Break of Structure (BOS) and Change of Character (CHOCH)
อินดิเคเตอร์
SMC
VWAP
+4
Killzone Session and key levels with VWAP – Precision Meets Price Action
"Market Cipher B" โลโก้
ยอดนิยม
4.6
(3)
$30
/
$50
อินดิเคเตอร์
AI
ATR
+27
Market Cipher B
อินดิเคเตอร์
SMC
Prop
+15
Auto-detects Swing Highs/Lows to draw dynamic Support & Resistance levels with break tracking.
อินดิเคเตอร์
EMA
Volume
+4
Advanced volume‑profile tool with delta, HVN/LVN zones, and precise POC‑based trade signals.
"Osvolt Trend Hunter" โลโก้
เรตติ้งสูง
4.6
(5)
$45
/
$60
อินดิเคเตอร์
ATR
RSI
+5
Multi-timeframe trend indicator using EMA, MACD & ADX to confirm high-probability buy and sell bias.

ราคา

99.81M
ปริมาณการเทรด
150.07K
Pips ที่ได้กำไร
96
การขาย
524
ติดตั้งฟรี