Description
Rubans VWAP
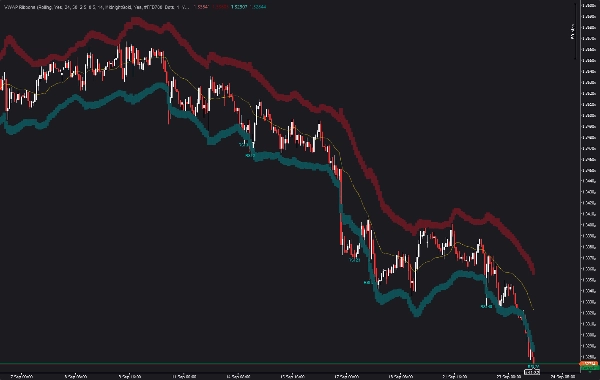
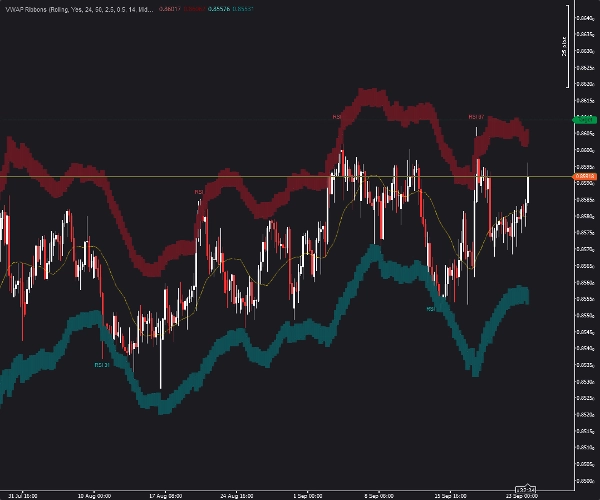
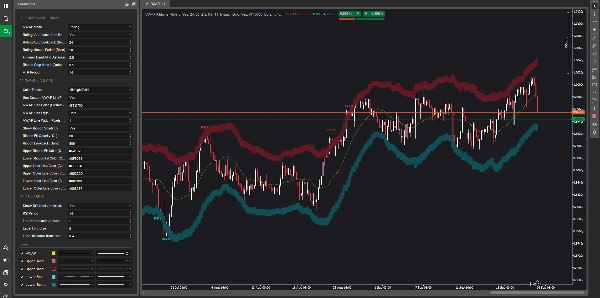
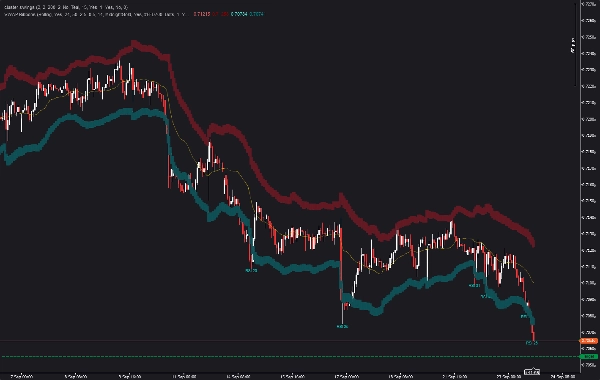
VWAP + Bandes ruban ATR à double couche avec étiquettes RSI sur les extrêmes de cassure — Étiquettes en formation en temps réel sur cTrader
Rubans VWAP est un indicateur cTrader qui trace une ligne de base du prix moyen pondéré par le volume roulante ou quotidienne, l'entoure de bandes de volatilité ATR à double couche, et étiquette automatiquement la valeur RSI à chaque extrême de cassure complétée — incluant une étiquette en direct qui se met à jour sur la barre en formation actuelle lorsque le prix pousse vers un nouvel extrême.
Conçu pour les traders qui souhaitent un contexte de volatilité clair autour du VWAP sans encombrement, ainsi que le contexte RSI à la barre exacte où le prix s'est étiré au-delà du ruban extérieur.
Natif cTrader • Pas de repeinture sur les barres complétées • Étiquettes en formation en temps réel • Cinq préréglages de thème
Ce que fait l'indicateur
Rubans VWAP répond à une question centrale :
Où se situe le prix par rapport à la juste valeur pondérée par le volume — et à quel point le mouvement actuel est-il étiré ?
L'indicateur affiche :
- Une ligne de base VWAP (fenêtre roulante ou réinitialisation quotidienne)
- Bande ATR intérieure (multiple k)
- Bande ATR extérieure (multiple k + step)
- Ombre optionnelle du ruban entre les bandes intérieure et extérieure
- Étiquettes RSI à chaque extrême de cassure complétée
- Étiquette RSI en direct suivant la cassure en formation actuelle
Les cassures sont définies comme toute barre dont le plus haut touche ou dépasse la bande extérieure supérieure (ou le plus bas touche/dépasse la bande extérieure inférieure), avec l'étiquette ancrée à la barre extrême de cette excursion — pas à la barre d'entrée ou de sortie.
Composants principaux
Ligne de base VWAP
Deux modes disponibles :
- Fenêtre roulante — VWAP continuellement mis à jour sur les N dernières barres. Le mode automatique déduit le nombre de barres à partir de votre unité de temps (par défaut 24 heures de données). Le mode manuel vous permet de spécifier directement le nombre de barres.
- Réinitialisation quotidienne — VWAP se réinitialise au début de chaque journée de trading.
Bandes ruban ATR à double couche
Bandes de volatilité intérieure et extérieure tracées autour de la ligne de base VWAP en utilisant l'Average True Range (lissage de Wilder pour correspondre à MetaTrader). La bande intérieure se situe à k × ATR ; la bande extérieure se situe à (k + step) × ATR. Les bandes s'élargissent et se contractent naturellement avec la volatilité.
Ombre du ruban
Remplissage semi-transparent optionnel entre les bandes intérieure et extérieure, créant un canal visuel. L'opacité est configurable. Le dessin du ruban est limité par une limite de retour en arrière pour maintenir une performance fluide sur les historiques longs.
Étiquettes RSI sur les cassures complétées
Chaque extrême de cassure complétée reçoit une étiquette RSI. L'étiquette est ancrée au plus haut de la barre extrême (pour les cassures supérieures) ou au plus bas (pour les cassures inférieures), décalée d'une distance ATR configurable. L'étiquette affiche la valeur RSI à cette barre.
Étiquettes de cassure en formation en direct
Une étiquette en direct dédiée suit en temps réel l'excursion de cassure de la barre en formation actuelle. À mesure que le prix pousse vers un nouvel extrême sur la bougie en formation, l'étiquette suit. Lorsque la barre se ferme, l'étiquette en direct devient une étiquette de cassure confirmée.
Comment ça fonctionne
- Le VWAP est calculé sur la période sélectionnée en utilisant le prix typique × volume ÷ volume total. Les tableaux de somme cumulative fournissent un coût exact O(1) par barre quelle que soit la taille de la fenêtre.
- L'ATR (lissage de Wilder) est calculé sur la période configurée. Les bandes intérieure et extérieure sont tracées à
ketk + stepmultiples au-dessus et en dessous de la ligne de base VWAP. - Une machine à états suit les excursions supérieures et inférieures :
-
- Une excursion commence lorsque le prix touche ou dépasse la bande extérieure.
- La barre extrême et le prix extrême sont mis à jour à mesure que le prix pousse plus loin.
- L'excursion se termine lorsque le prix se referme à l'intérieur de la bande intérieure.
- La barre extrême est enregistrée comme une cassure complétée.
- Les étiquettes RSI sont dessinées à la barre extrême de chaque cassure complétée.
- Une étiquette en direct est maintenue sur la barre en formation actuelle, mise à jour à chaque tick jusqu'à la fermeture de la barre.
Ce que vous voyez sur le graphique
- Ligne VWAP (couleur, style et largeur en pixels personnalisés)
- Quatre lignes de limite de bande (intérieure pointillée, extérieure pleine — supérieure et inférieure)
- Ombre optionnelle du ruban entre les bandes intérieure et extérieure
- Étiquettes RSI au-dessus des extrêmes de cassure supérieurs (montrant le RSI à cette barre)
- Étiquettes RSI en dessous des extrêmes de cassure inférieurs (montrant le RSI à cette barre)
- Étiquette RSI en direct suivant la cassure en formation actuelle
Cinq préréglages de thème :
Midnight Gold · Neon · Ocean · Light Chart · Custom
Comportement historique, en direct et sans repeinture
Tous les calculs de cassure complétée utilisent uniquement des barres fermées. Une fois qu'une barre se ferme et qu'un extrême de cassure est enregistré, l'étiquette ne change plus.
L'étiquette de cassure en formation en direct se met à jour tick par tick à mesure que la barre actuelle se développe — il s'agit d'une lecture provisoire qui n'est pas finale tant que la barre ne se ferme pas. Lorsque la barre se ferme, l'excursion est soit confirmée comme une cassure complétée (et une étiquette permanente est placée), soit abandonnée si le prix s'est refermé à l'intérieur de la bande intérieure.
L'étiquette en direct est visuellement identique aux étiquettes complétées mais reflète toujours l'état actuel de la barre en formation.
Architecture des paramètres
01. Noyau — VWAP + Bandes
Mode VWAP (Roulant / Quotidien) · Roulant Auto (barres selon unité de temps) · Roulant Auto Lookback (heures) · Période manuelle roulante (barres) · k — Distance ATR de la bande intérieure · Pas du ruban à partir de k · Période ATR
02. Thème + Couleurs
Préréglage de thème · Bascule ligne VWAP personnalisée · Couleur ligne VWAP · Style ligne VWAP · Largeur ligne VWAP · Bascule ombrage du ruban · Opacité du remplissage du ruban · Barres de retour en arrière du ruban · Couleurs de remplissage du ruban supérieur / inférieur · Couleurs des lignes intérieure / extérieure supérieures / inférieures
03. Étiquettes RSI
Afficher les étiquettes RSI · Période RSI · Dernières N cassures à étiqueter · Taille de police des étiquettes · Distance de l'étiquette par rapport à l'extrême (× ATR)
Scénarios pratiques de marché
Le prix dépasse la bande extérieure et se referme à l'intérieur
Le prix progresse à travers les bandes supérieure intérieure et extérieure, imprimant un nouveau sommet. Une étiquette RSI est placée à cette barre extrême montrant la lecture RSI au moment de l'étirement maximal. Si le RSI était au-dessus de 70, l'étiquette signale visuellement une excursion en surachat à la bande extérieure.
Tendance soutenue avec multiples cassures
Le prix progresse lentement sur de nombreuses barres, dépassant à plusieurs reprises la bande extérieure. Chaque nouvel extrême qui se referme à l'intérieur de la bande intérieure est enregistré comme un événement de cassure distinct, avec sa propre étiquette RSI. Le regroupement des étiquettes révèle rapidement si le RSI monte, reste stable ou diverge au fil des poussées successives.
Cassure en formation en direct
Le prix appuie actuellement contre la bande supérieure extérieure. Une étiquette RSI en direct suit l'extrême de la barre en formation actuelle. À mesure que la barre se développe, l'étiquette se met à jour tick par tick. Lorsque la barre se referme à l'intérieur de la bande intérieure, l'étiquette devient une étiquette permanente de cassure complétée.
Compression et expansion du ruban
La largeur du ruban s'élargit pendant les mouvements de tendance et se contracte pendant les périodes calmes. Lorsque le ruban se resserre, le prix se referme souvent rapidement à l'intérieur de la bande intérieure après avoir touché la bande extérieure — indiquant des excursions peu profondes. Lorsque le ruban s'élargit, les excursions ont tendance à durer plus longtemps.
Compatibilité
- Plateforme : cTrader (API cAlgo)
- Classes d'actifs : Forex, métaux incluant XAUUSD, indices incluant US30, NAS100 et GER40, matières premières et instruments crypto
- Unités de temps : M5, M15, H1, H4, Quotidien
- Données de volume : volume tick fourni par le courtier
- Dépendances : Aucune. cAlgo natif, pas de bibliothèques externes
Notes techniques
L'indicateur est entièrement écrit en cAlgo (C#). Le VWAP roulant utilise des tableaux de somme cumulative — le coût par barre reste constant quelle que soit la longueur de la fenêtre. Toute la logique de cassure complétée utilise des données de barres fermées.
La machine à états de cassure suit le plus haut maximum (pour les excursions supérieures) ou le plus bas minimum (pour les excursions inférieures) tant que le prix reste au-delà de la bande extérieure. La barre extrême enregistrée est celle où l'excursion a atteint son maximum — pas la barre d'entrée ou de sortie.
Les étiquettes en formation en direct sont dessinées comme des objets texte sur le graphique avec des noms uniques par horodatage extrême, assurant des mises à jour fluides sans création excessive d'objets. Les étiquettes complétées sont suivies et nettoyées automatiquement lorsqu'elles sortent de la fenêtre "Dernières N".
Le remplissage du ruban utilise des objets rectangle sur le graphique avec des connecteurs verticaux automatiques, garantissant un ombrage sans couture entre les barres.
À qui s'adresse cet indicateur ?
Rubans VWAP convient aux traders qui veulent :
- Une référence VWAP claire avec un contexte de volatilité
- Un ruban visible basé sur l'ATR pour l'analyse de l'étirement
- Des lectures RSI à la barre exacte de l'étirement maximal du prix
- Un suivi en direct de la cassure en formation actuelle
- Un encombrement minimal du graphique avec un retour en arrière configurable du ruban
Utilisez-le en complément de méthodologies plus larges impliquant l'action des prix, l'analyse du volume, la réversion à la moyenne ou la continuation de tendance.
L'indicateur fournit une visualisation analytique — pas un signal d'achat ou de vente.
Achat
Rubans VWAP est disponible via le cTrader Store. Votre achat inclut un accès à vie, cinq préréglages de thème et un support direct du développeur.
Rubans VWAP — Indicateur VWAP cTrader | VWAP roulant | VWAP quotidien | Bandes ATR | Ruban ATR | Ruban VWAP | Étiquettes RSI | Étiquettes de cassure | Étiquettes en formation en direct | Indicateur cTrader | Indicateur cAlgo | Signaux sans repeinture | Prix moyen pondéré par le volume | Indicateur XAUUSD | Indicateur US30 | Indicateur NAS100 | Réversion à la moyenne | Bandes de volatilité | Surachat Survente
Résumé
Key features include customizable VWAP modes, ATR band multipliers, optional shaded ribbons between bands, and configurable RSI label display. Breakouts are identified by excursions beyond the outer bands that close back inside the inner bands, with labels anchored to the extreme bar of each breakout. The indicator supports multiple timeframes (M5 to Daily) and asset classes including Forex, metals (e.g., XAUUSD), indices (e.g., US30, NAS100), commodities, and cryptocurrencies, using broker-supplied tick volume data.
VWAP Ribbons is designed for traders seeking clear volatility and momentum context around VWAP with minimal chart clutter. It provides analytical visualization without generating buy or sell signals. Five theme presets and extensive customization options are included.