Description
Professional Volume Analysis with Smart Candle-Based Delta Calculation
Unlock the power of institutional-grade volume analysis with ANCHORED DELTA CANDLE VOLUME PROFILE, the most advanced anchored volume profile indicator for cTrader. Designed for serious traders who demand precise market insight, this indicator reveals where the real market activity happens through intelligent candle-based delta calculation.
🎯 KEY FEATURES
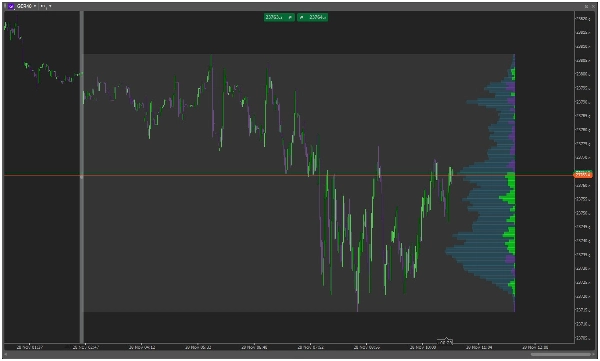
🏓 SMART ANCHORING SYSTEM
- Simply draw a vertical line anywhere on your chart
- Automatic profile generation anchored to your chosen point
- Dynamic updates as new price action develops
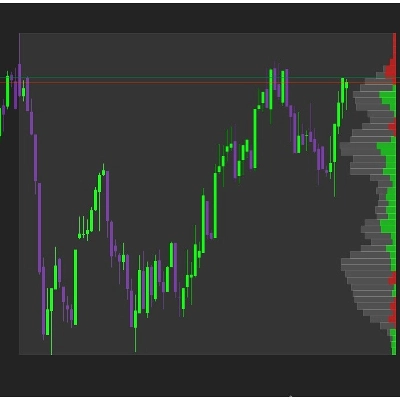
📊 INTELLIGENT CANDLE-BASED DELTA
- Advanced delta analysis based on candle direction
- Green candles = Buy Volume | Red candles = Sell Volume
- Clean, single-color visualization per price level
- Instant identification of buying/selling pressure zones
🎨 CUSTOMIZABLE VISUAL DESIGN
- Adjustable profile width (5-100% of range)
- Customizable colors for buy/sell/total volume
- Transparency controls for perfect chart integration
- Professional shading for enhanced readability
⚡ FLEXIBLE DISPLAY MODES
- Delta Mode: See net buying/selling pressure at each price level
- Volume Mode: Traditional volume profile display
- Right-anchored for optimal chart space utilization
🚀 WHY TRADERS LOVE IT
"Finally, a volume profile that just works! The candle-based delta calculation is incredibly accurate for spotting institutional activity." - Professional Trader
"Game-changer for my market profile analysis. The anchoring system is brilliant and the candle-based approach makes so much sense." - Institutional Analyst
📈 PERFECT FOR
- Market Profile Traders - Identify value areas and poor highs/lows
- Auction Market Theorists - Understand market development processes
- Volume-based Strategies - Confirm breakouts with volume validation
- Institutional Flow Analysis - Spot smart money accumulation/distribution
🛠 EASY TO USE
- Draw a vertical line at your anchor point
- Watch as the ANCHORED DELTA CANDLE VOLUME PROFILE automatically generates
- Analyze the delta distribution across price levels
- Trade with confidence using volume-confirmed levels
🔧 TECHNICAL SPECIFICATIONS
- Real-time calculation
- Low resource consumption
- Compatible with all timeframes
- Works with all instruments (Forex, Stocks, Crypto, Futures)
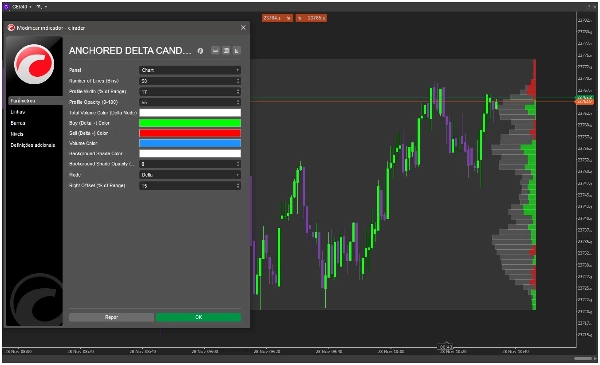
📋 PARAMETERS INCLUDED
- Number of Lines/Bins (5-100)
- Profile Width Percentage
- Opacity Controls
- Custom Color Schemes
- Right Offset Adjustment
- Display Mode (Delta/Volume)
🎯 TRANSFORM YOUR CHART ANALYSIS TODAY!
Join thousands of professional traders who have elevated their market analysis with ANCHORED DELTA CANDLE VOLUME PROFILE. Stop guessing and start seeing where the real market activity happens through precise candle-based delta calculation.
⭐ "The clarity this indicator brings to volume analysis is unmatched. The candle-based delta approach is pure genius."
Add ANCHORED DELTA CANDLE VOLUME PROFILE to your cTrader platform today and trade with institutional-level insight!


