Description
https://chartshots.spotware.com/c/695bec6c74055
https://chartshots.spotware.com/c/695bed35bf7b7
https://chartshots.spotware.com/c/695bed6b139df
https://chartshots.spotware.com/c/695bed8ea6bdb
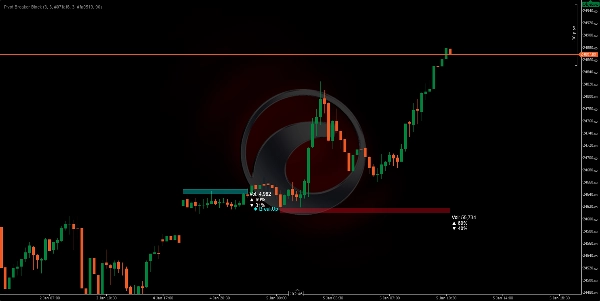
📊 PIVOT BREAKER BLOCK
🤔
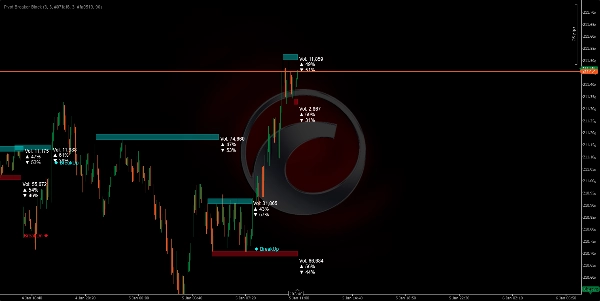
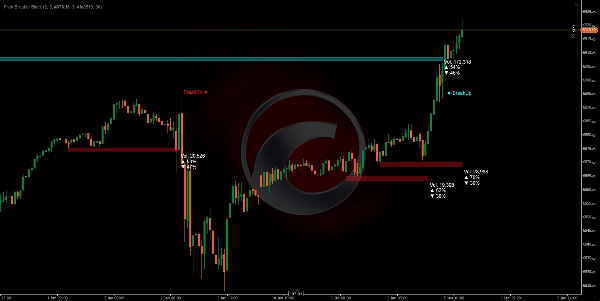
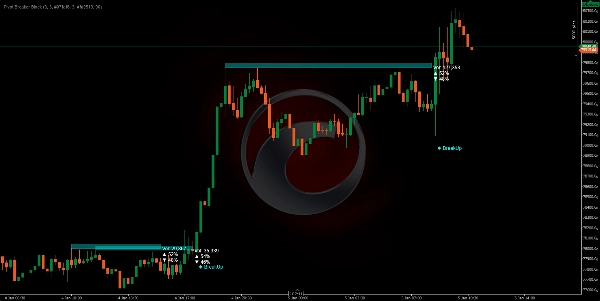
The Pivot Breaker Block is a visual indicator that automatically identifies key price turning points (local highs and lows) and builds "price blocks" around these critical levels. When the price approaches these similar levels again, the algorithm draws rectangles (zones) representing resistance (Supply) and support (Demand) areas.
The system continuously monitors if the price breaks through these zones, generating clear visual signals: BreakUp (bullish breakout) 🔼 or BreakDn (bearish breakout) 🔽.
WHAT IS IT FOR? 🎯
1. Identify Market Control Zones 🗺️
The algorithm detects where the price has shown strong resistance (selling ceiling) or support (buying floor). When these levels appear multiple times, the market confirms their importance.
2. Visualize Volume Accumulation and Distribution ⚖️
Each block shows:
- Total volume processed in that zone
- % of buys (bullish candles) 📈
- % of sells (bearish candles) 📉
This lets you see if the market is buying or selling within that area, revealing the market's intention.
3. Anticipate Breakout Points 🚨
When the price approaches these zones, you have the highest probability of a significant move occurring. The algorithm automatically detects when the price breaks through them, alerting you in real-time.
HOW THE LOGIC WORKS ⚙️
Phase 1: Pivot Detection (Turning Points) 🔍
The algorithm looks for highs and lows that meet a specific criterion:
- Pivot High: A candle whose high is higher than the 5 previous candles AND the 5 subsequent candles.
- Pivot Low: A candle whose low is lower than the 5 previous candles AND the 5 subsequent candles.
This "5" parameter (Pivot Lookback) is adjustable based on the volatility you want to capture.
Phase 2: Control Zone Recognition 🎯
Once a pivot is identified, the system compares it with the previous pivot of the same type. If the difference between them is less than 20% of the ATR (current volatility measure), it means the market is revisiting a previously rejected similar level.
Phase 3: Zone Sizing 📏
The height of each block is calculated dynamically using the ATR (Average True Range):
- Supply (Red): The ceiling is ATR × 0.5 points above the pivot.
- Demand (Cyan): The floor is ATR × 0.5 points below the pivot.
This means zones automatically adapt to the asset's volatility. In volatile markets, zones are wider; in calm markets, they are tighter.
Phase 4: Real-Time Volume Analysis 💹
While the price is inside the zone, the algorithm sums all buy and sell volumes since the block started:
- Buy: All candles where the close is greater than the open (bullish volume).
- Sell: All candles where the close is less than the open (bearish volume).
These percentages show you the dominant intention within that zone.
Phase 5: Breakout Detection 🚀
The algorithm monitors each new candle:
- BreakUp (↑): The close crosses above the Supply ceiling → Bullish breakout signal.
- BreakDn (↓): The close falls below the Demand floor → Bearish breakout signal.
When this happens, the block is deactivated and an on-screen text signal appears.
HOW TO USE IT 🛠️
Installation and Configuration ⚙️
- Add the indicator to your cTrader platform.
- Access the adjustable parameters:
ParameterMeaningRecommendation
Pivot Lookback
How many candles left/right are evaluated to confirm a pivot
5 (standard), increase on higher TFs
Supply Zone Factor
Height of the red block (Resistance)
5.0 (standard), adjust to preference
Demand Zone Factor
Height of the cyan block (Support)
5.0 (standard), adjust to preference
Transparency
Block opacity (0=invisible, 255=solid)
90 (recommended for visibility)
Colors
Customize the visual appearance
Red for Supply, Cyan for Demand
Trading Strategy 💡
Scenario 1: Long Entry (Buy) 📈
- Wait for the price to form a Demand block (cyan) with a % of buys > 55%.
- Upon seeing a BreakUp, confirm your bullish entry.
- Stop Loss (SL) below the block's floor.
Scenario 2: Short Entry (Sell) 📉
- Look for a Supply block (red) with a % of sells > 55%.
- On the BreakDn, open a bearish position.
- Stop Loss (SL) above the block's ceiling.
Scenario 3: Reversal (Mean Reversion) 🔄
- If the price is inside a Demand block but the % of buys is low (< 45%)...
- Anticipate the price will bounce up without reaching a BreakUp.
- Enter a buy near the floor with Take Profit (TP) at the ceiling.
Optimal Timeframes ⏰
- H4/D1: More significant blocks, longer-duration movements.
- H1: Good balance between noise and opportunities.
- M15: Quick entry, requires volume confirmation.
Summary
The indicator continuously monitors price action relative to these zones, providing real-time breakout signals: "BreakUp" for bullish breakouts above resistance and "BreakDn" for bearish breakouts below support. Each block displays cumulative volume data, including total volume processed and the percentage of buying (bullish) versus selling (bearish) activity, helping traders assess market intention within these areas.
Pivot Breaker Block supports multiple trading strategies, including breakout entries and mean reversion, with configurable parameters such as pivot lookback period, zone height factors, and visual transparency. It is suitable for various markets including Forex, indices, commodities, stocks, and cryptocurrencies, and works effectively on timeframes from 15 minutes to daily charts.
Key features:
- Automatic pivot detection with adjustable lookback
- Dynamic supply and demand zone sizing based on ATR
- Real-time volume accumulation and buy/sell ratio visualization
- Breakout alerts with on-screen signals
- Supports multiple asset classes and timeframes for versatile use