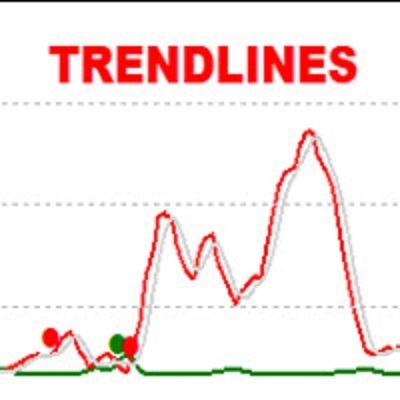
Description
The Trendlines Oscillator helps traders identify trends and momentum based on the normalized distances between the current price and the most recently detected bullish and bearish trend lines.
The indicator features bullish and bearish momentum, a signal line with crossings, and multiple smoothing options.
USAGE
The Trendlines Oscillator works by systematically:
- Identifying pivot highs and lows.
- Connecting pivots to form bullish (support) and bearish (resistance) trendlines.
- Measuring the distance (delta) between the current price and those trendlines.
- Normalizing these distances between 0 and 100 to create momentum values.
- Smoothing the values for cleaner signals.
- Generating bullish and bearish signals when momentum crosses the signal line.
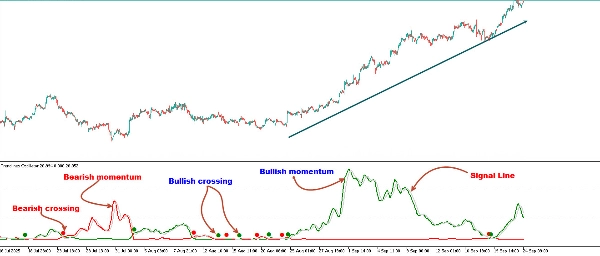
The oscillator displays three key lines:
Bullish Momentum Line (Green): Measures buyer strength by calculating how far the price is from recent bullish support trendlines.
Bearish Momentum Line (Red): Measures seller strength by calculating how far the price is from recent bearish resistance trendlines.
Signal Line (Gray): Provides crossovers with the momentum lines to highlight potential trading opportunities.
As a general rule, when the bullish momentum line is above the bearish momentum line, it indicates buyer strength. This means that the actual prices are farther from the support trend lines than the resistance trend lines. The opposite is true for seller strength.
To calculate bullish momentum, the tool first identifies bullish trend lines acting as support below the price. Then, it measures the delta between the price and those trend lines and normalizes the reading into the displayed momentum values.
The same process is used for bearish momentum, but with bearish trendlines acting as resistance above the price.
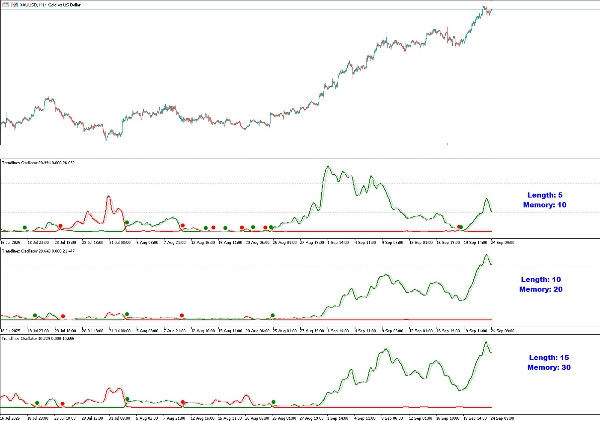
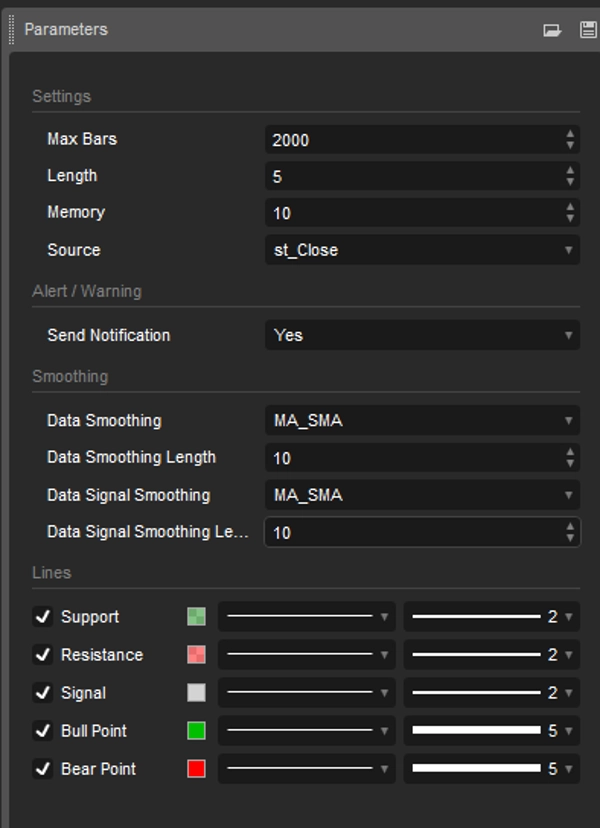
Length & Memory
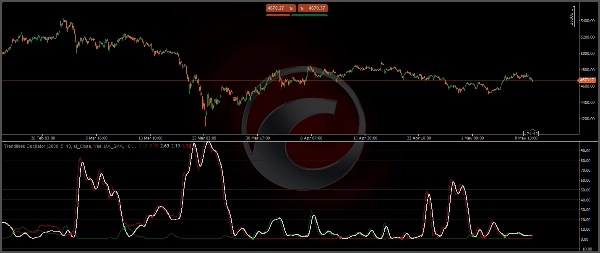
- Length: Determines the size of market structure used for detecting trendlines. Larger values capture broader trends, while smaller values make the tool more sensitive to short-term moves.
- Memory: Controls how many trendlines are considered in calculations. Higher memory values smooth out signals for long-term analysis, while smaller memory values offer quicker reactions.
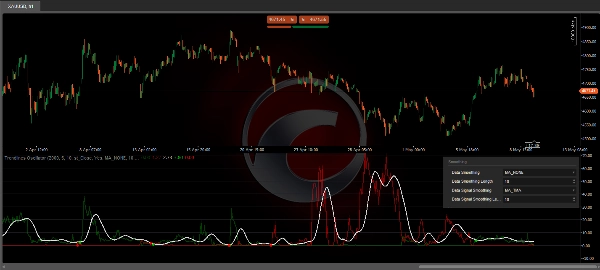
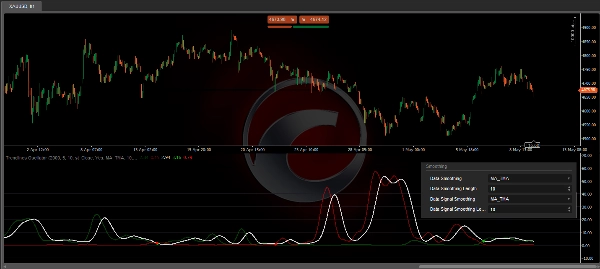
Modifying the Length and Memory values will cause the tool to display different momentum values.
Traders can adjust the length to detect larger trendlines and adjust the memory to indicate how many trendlines the tool should consider.
As the chart above shows, smaller values make the tool more responsive, while larger values are useful for detecting larger trends.
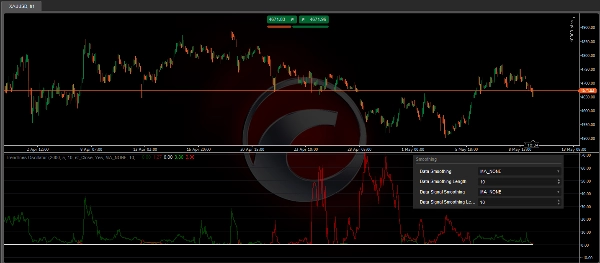
Smoothing
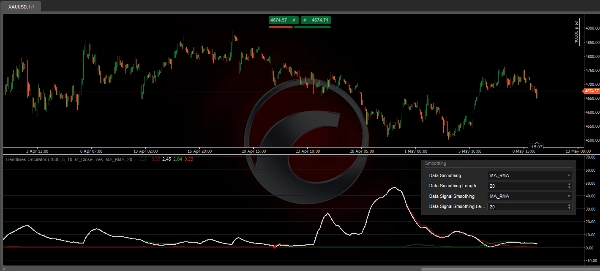
- Data Smoothing: Applies smoothing to the raw momentum values.
- Signal Smoothing: Smooths the signal line itself for clearer crossover points.
By default, the data is smoothed by SMA, and the signal uses a triangular moving average with a length of 10. Traders can smooth both the data and the signal line.
Traders can choose different methods, or none. Some examples are shown on the attact images.
SETTINGS
- Length: The size of the market structure used for trendline detection.
- Memory: The number of trendlines used in calculations.
- Source: The source for the calculations is closing prices by default.
- Data Smoothing: Choose the smoothing method and length
- Signal Smoothing: Choose the smoothing method and length
- Alert: Alert/Notification when Bullish/Bearish Cross
- Styles: Adjust color, style, width of Support/Resistance/Signal lines
The Trendlines Oscillator trading indicator is ideal for traders who want:
- A trendline-based view of momentum rather than relying solely on moving averages or RSI.
- Clear visual crossovers to signal potential entries and exits.
- Customizable smoothing for adapting to different trading styles.
- A tool that highlights buyer vs seller dominance in real time.
- By combining structural market analysis with momentum calculations, this tool provides a unique edge in spotting both trend continuation and reversal opportunities.
Summary
Users can customize the indicator’s sensitivity and responsiveness by adjusting the Length (market structure size for trendline detection) and Memory (number of trendlines considered). The tool also offers data and signal smoothing options using various methods, including SMA and triangular moving averages, to provide clearer signals. The Trendlines Oscillator supports alerts for bullish and bearish crossovers and allows customization of line styles and colors. It provides a structural market analysis combined with momentum calculations to help traders assess buyer versus seller dominance and identify trend continuation or reversal opportunities.


!["[CB] Pivot Points Pro" logo](https://cdn.ctrader.com/image/webp/43463c82-67b0-4f10-a4ba-901bba091d81_32594)


