
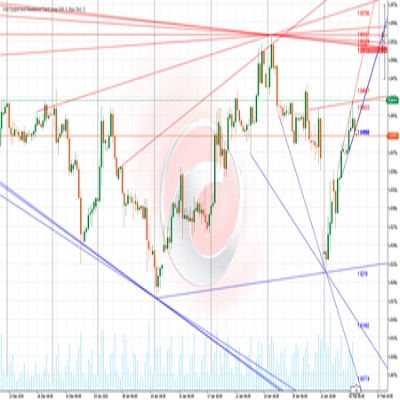
Auto Support and Resistance Trend Lines
Индикатор
Версия 1.0, Feb 2025
Windows, Mac
С 03/10/2024
177
Продажи
45.37K
Бесплатные установки
Описание
Сводка
ИИ-сводка
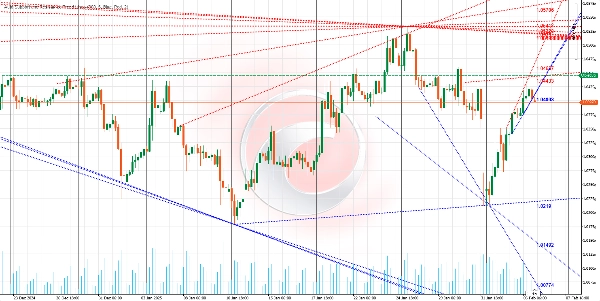
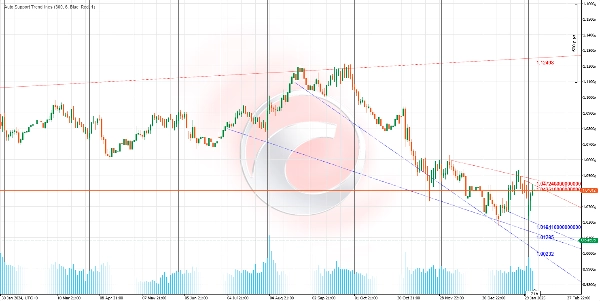
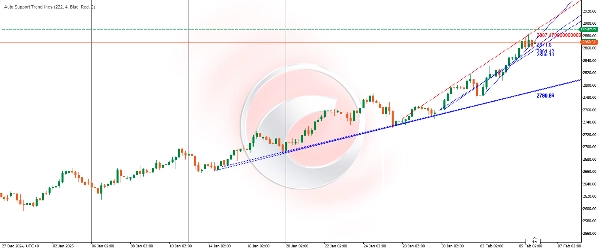
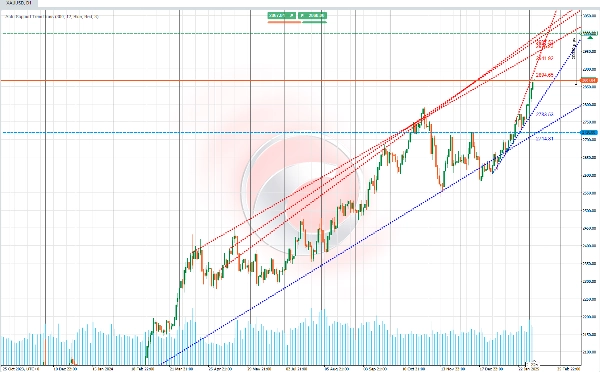
Auto Support and Resistance Trend Lines is an indicator that automatically identifies and draws key support and resistance levels on price charts. It detects both horizontal lines and diagonal channels that represent market trends, highlighting areas where price has historically struggled to move higher (resistance) or lower (support).
The algorithm analyzes price history by identifying local lows and highs within a specified range of bars. It validates these levels by checking if the price has respected them multiple times in the past. Validated support and resistance levels are drawn as horizontal or diagonal lines. Additionally, the indicator connects these levels to form diagonal channels that indicate bullish or bearish trends.
The indicator updates dynamically with each new bar, recalculating and redrawing levels based on the latest price action. Traders can customize parameters such as the number of bars analyzed, line thickness, and colors to suit different trading styles and visual preferences.
This tool aids traders by providing a macro view of market trends, identifying critical support and resistance zones useful for setting entry and exit points, stop-loss and take-profit orders, and spotting potential breakouts or reversals. It automates technical analysis, saving time and helping traders make more informed decisions.
The algorithm analyzes price history by identifying local lows and highs within a specified range of bars. It validates these levels by checking if the price has respected them multiple times in the past. Validated support and resistance levels are drawn as horizontal or diagonal lines. Additionally, the indicator connects these levels to form diagonal channels that indicate bullish or bearish trends.
The indicator updates dynamically with each new bar, recalculating and redrawing levels based on the latest price action. Traders can customize parameters such as the number of bars analyzed, line thickness, and colors to suit different trading styles and visual preferences.
This tool aids traders by providing a macro view of market trends, identifying critical support and resistance zones useful for setting entry and exit points, stop-loss and take-profit orders, and spotting potential breakouts or reversals. It automates technical analysis, saving time and helping traders make more informed decisions.
Профиль индикатора
Обсуждение
Отзывы покупателей
0.0
Отзывы: 0
Отзывы покупателей
У этого продукта еще нет отзывов. Уже попробовали его? Поделитесь впечатлениями!
Частые вопросы
Supertrend
RSI
Продукты, доступные в cTrader Store, включая торговых ботов, индикаторы и плагины, предоставляются сторонними разработчиками и доступны исключительно в информационных и технических целях. cTrader Store не является брокером и не предоставляет инвестиционные консультации, персональные рекомендации или какие-либо гарантии будущей доходности.





























Цена
С 03/10/2024
177
Продажи
45.37K
Бесплатные установки