
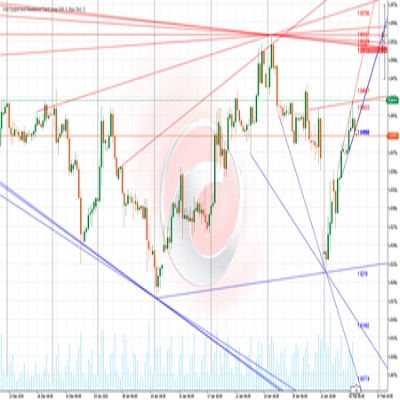
Auto Support and Resistance Trend Lines
指标
版本 1.0, Feb 2025
Windows 版、Mac 版
注册日期 03/10/2024
177
销售
45.37K
免费安装
说明
摘要
AI 摘要
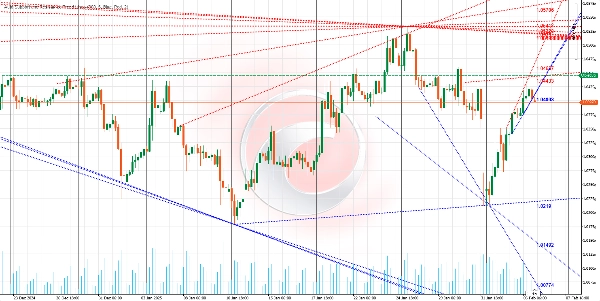
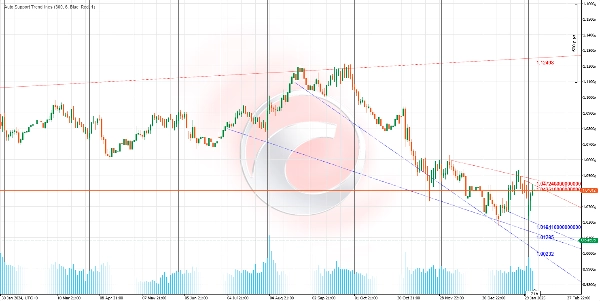
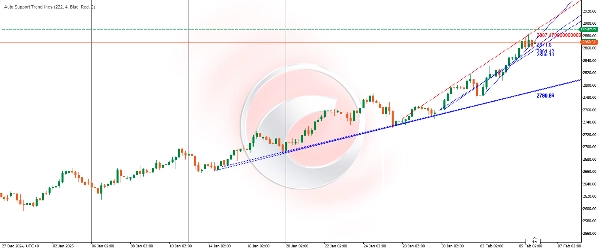
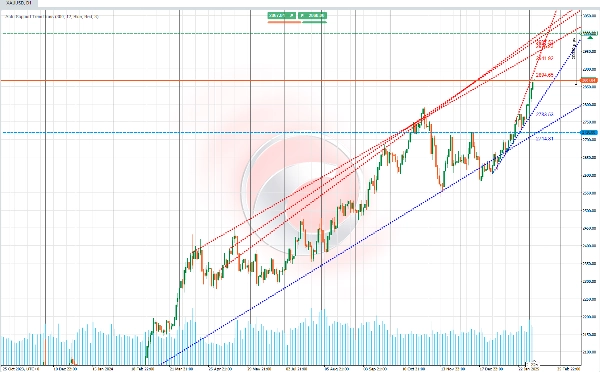
Auto Support and Resistance Trend Lines is an indicator that automatically identifies and draws key support and resistance levels on price charts. It detects both horizontal lines and diagonal channels that represent market trends, highlighting areas where price has historically struggled to move higher (resistance) or lower (support).
The algorithm analyzes price history by identifying local lows and highs within a specified range of bars. It validates these levels by checking if the price has respected them multiple times in the past. Validated support and resistance levels are drawn as horizontal or diagonal lines. Additionally, the indicator connects these levels to form diagonal channels that indicate bullish or bearish trends.
The indicator updates dynamically with each new bar, recalculating and redrawing levels based on the latest price action. Traders can customize parameters such as the number of bars analyzed, line thickness, and colors to suit different trading styles and visual preferences.
This tool aids traders by providing a macro view of market trends, identifying critical support and resistance zones useful for setting entry and exit points, stop-loss and take-profit orders, and spotting potential breakouts or reversals. It automates technical analysis, saving time and helping traders make more informed decisions.
The algorithm analyzes price history by identifying local lows and highs within a specified range of bars. It validates these levels by checking if the price has respected them multiple times in the past. Validated support and resistance levels are drawn as horizontal or diagonal lines. Additionally, the indicator connects these levels to form diagonal channels that indicate bullish or bearish trends.
The indicator updates dynamically with each new bar, recalculating and redrawing levels based on the latest price action. Traders can customize parameters such as the number of bars analyzed, line thickness, and colors to suit different trading styles and visual preferences.
This tool aids traders by providing a macro view of market trends, identifying critical support and resistance zones useful for setting entry and exit points, stop-loss and take-profit orders, and spotting potential breakouts or reversals. It automates technical analysis, saving time and helping traders make more informed decisions.
指标配置
讨论
客户评价
0.0
评价:0
客户评价
该产品尚无评价。已经试过了?抢先告诉其他人!
常见问答
Supertrend
RSI
cTrader Store 提供的所有产品,包括交易机器人、指标和插件,均由第三方开发者提供,仅供信息参考和技术访问之用。cTrader Store 并非经纪商,不提供投资建议、个人推荐或任何未来业绩保证。













!["[Stellar Strategies] VBO" 标识](https://cdn.ctrader.com/image/webp/f034c012-94d4-445a-a01b-febd1cdedaef_36944)















价格
注册日期 03/10/2024
177
销售
45.37K
免费安装