
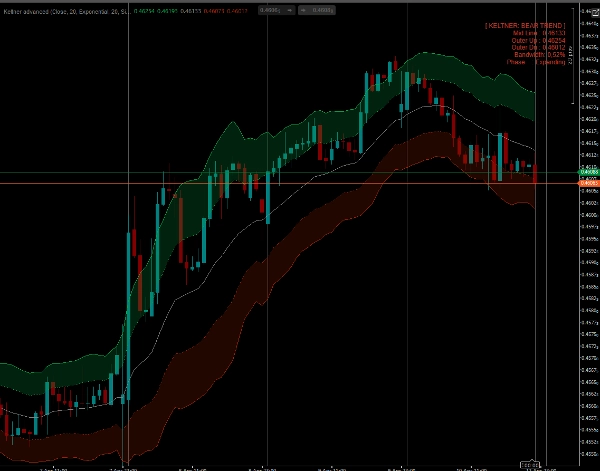
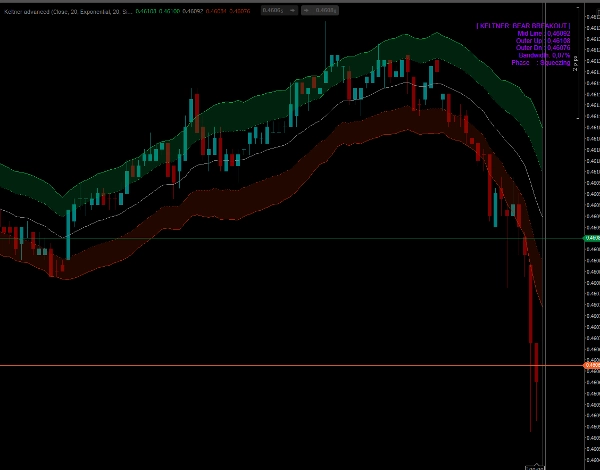

설명
켈트너 채널 고급 클라우드 및 돌파 시스템
표준 켈트너 채널은 변동성과 추세 방향을 읽는 훌륭한 도구이지만, 차트에 단순한 선을 그리는 것은 시작에 불과합니다.
이 켈트너 고급는 이 고전적인 지표를 완전히 새로운 수준으로 끌어올립니다. 듀얼 밴드 클라우드 시스템, 밴드폭 압축 감지, 스마트 페인트바를 도입하여 단순한 채널을 돌파 및 추세 추종 트레이더를 위한 완전한 시각적 거래 시스템으로 변모시킵니다.
주요 특징
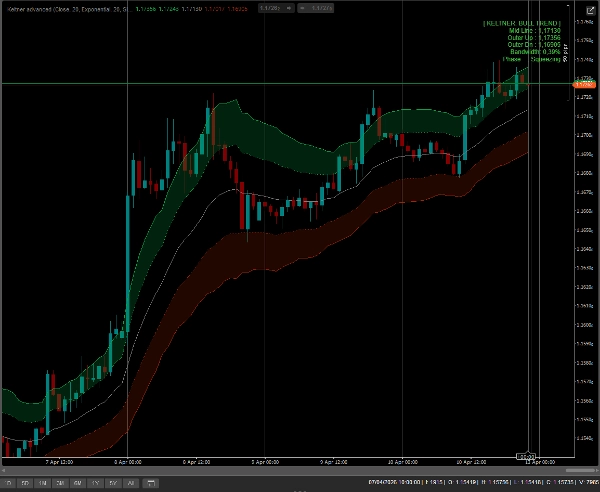
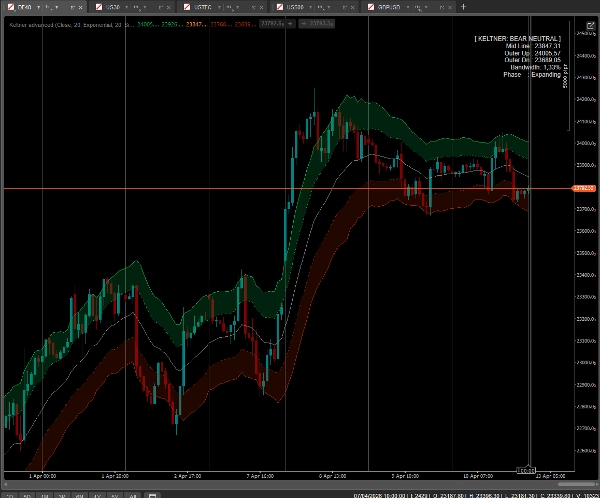
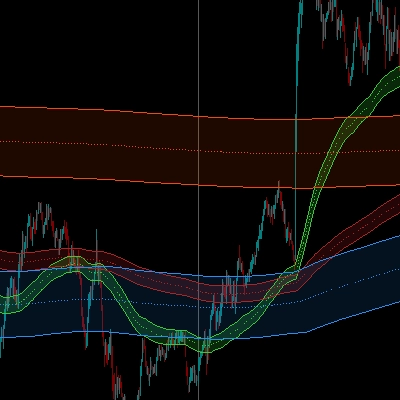
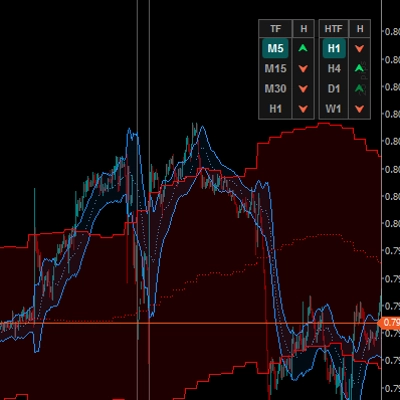
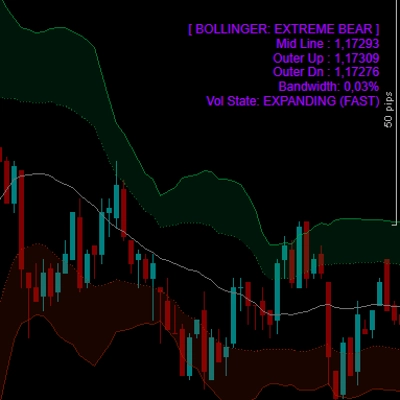
- 듀얼 밴드 클라우드 시스템 (액션 존): 하나의 채널 대신, 이 지표는 내부 밴드와 외부 밴드를 표시합니다. 그 사이 공간은 동적인 클라우드로 채워집니다.
-
- 가격이 클라우드 안에 있나요? 강력하고 건강한 "추세 타기" 상태입니다.
- 가격이 중간선과 내부 밴드 사이에 있나요? 되돌림/평균 회귀 단계에 있습니다.
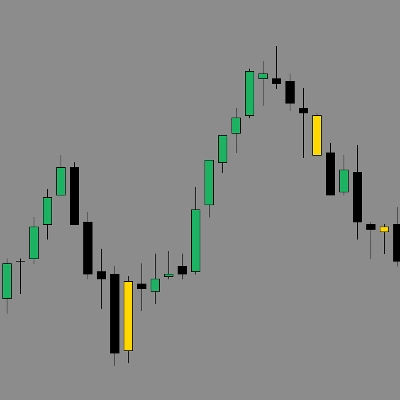
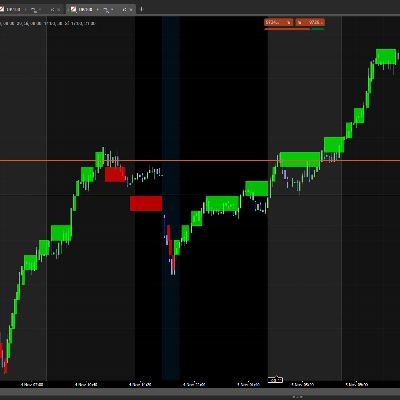
- 스마트 바 색상 지정 (페인트바): 캔들스틱은 채널 구조 내 정확한 위치에 따라 색상이 변경됩니다:
-
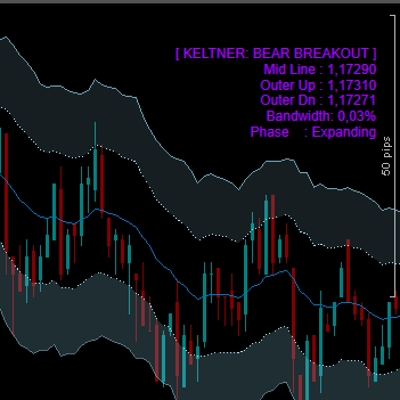
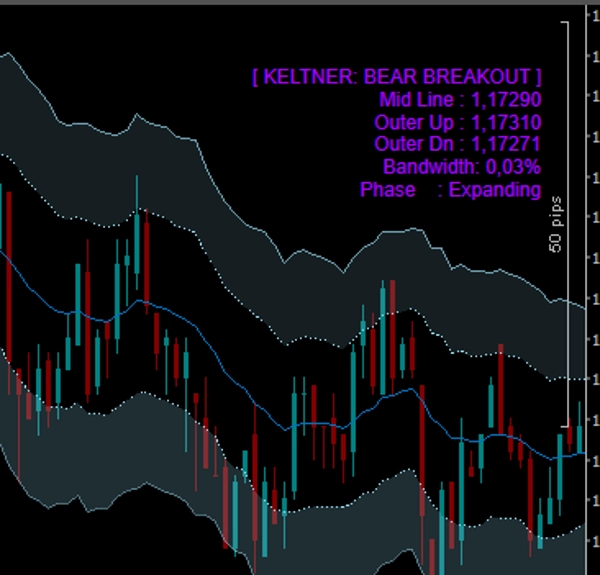
- 네온 그린/레드 (극단): 가격이 외부 밴드를 돌파합니다. 강력한 모멘텀 또는 클라이맥스!
- 밝은 그린/레드 (추세): 가격이 켈트너 클라우드 안에서 움직입니다.
- 어두운 그린/레드 (되돌림): 가격이 중간선으로 되돌아갑니다.
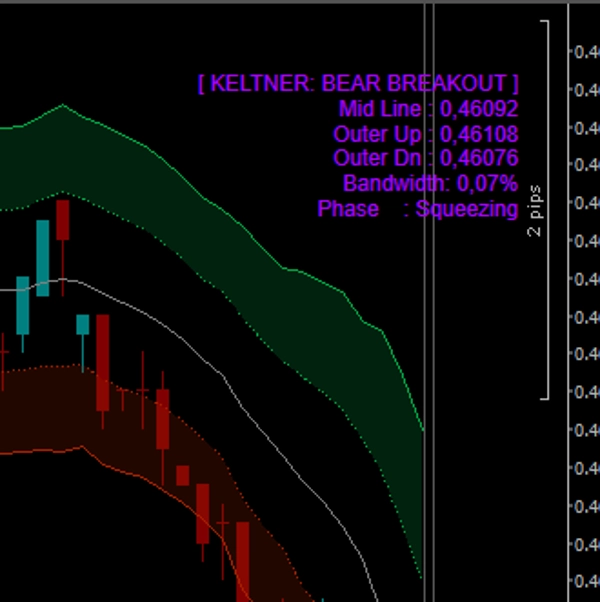
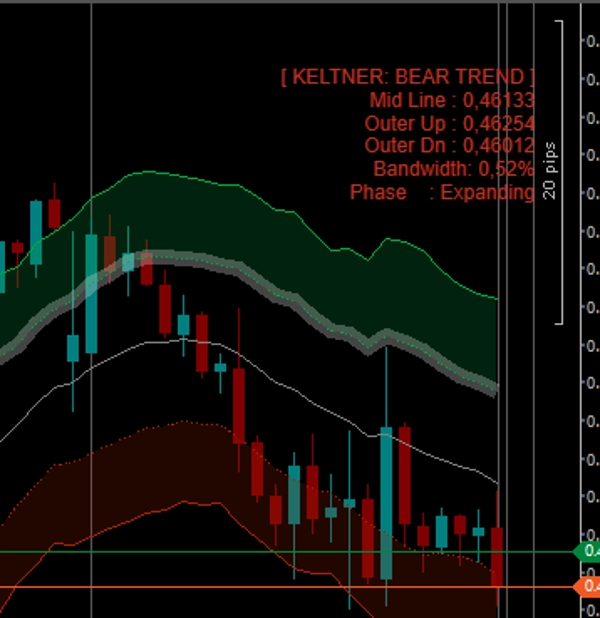
- 밴드폭 압축 감지: 이 지표는 채널의 폭을 지속적으로 계산하고 이전 바와 비교합니다. 대시보드는 시장이 압축 중인지(돌파를 위한 압축) 또는 확장 중인지 정확히 알려줍니다.
- 실시간 차트 내 대시보드: 세련되고 방해되지 않는 패널이 현재 시장 상태(강세 추세, 약세 돌파, 중립 등), 정확한 밴드 레벨, 밴드폭 백분율 및 변동성 단계를 표시합니다.
- 완전한 잠금 해제: 모든 심볼(외환, 암호화폐, 지수, 주식)과 모든 시간대에서 제한 없이 거래할 수 있습니다. 평생 접근 권한 제공.
어떻게 거래하나요?
- 돌파: 대시보드에서 "압축" 단계를 확인하세요. 가격이 외부 밴드 밖으로 폭발하고 캔들이 네온 그린 또는 레드로 칠해지면 강한 모멘텀과 함께 돌파를 거래하세요.
- 추세 타기: 추세가 형성되면 캔들이 밝은 그린/레드로 칠해지고 클라우드 안에서 "미끄러지는" 동안 거래를 유지하세요.
- 조정 구간 매수: 가격이 주황색 중간선으로 되돌아올 때(캔들이 어두운 녹색으로 변함), 이는 주요 추세에 합류하기 위한 저위험 진입 기회를 자주 제공합니다.
요약
AI 요약
Keltner Channels Advanced is a volatility and trend analysis indicator that enhances the traditional Keltner Channels by incorporating a Dual-Band Cloud System, Bandwidth Squeeze Detection, and Smart Paintbars. It plots two bands—Inner and Outer—with a dynamic cloud between them to visually represent market action zones. Price positioning within these zones indicates trend strength, pullbacks, or extreme momentum.
Key features include:
- Dual-Band Cloud System: Differentiates between strong trend rides, pullbacks, and mean-reversion phases.
- Smart Bar Coloring: Candlesticks change color based on their location relative to the bands, signaling extremes, trends, or pullbacks.
- Bandwidth Squeeze Detection: Continuously measures channel width to identify market compression phases that often precede breakouts.
- Real-Time On-Chart Dashboard: Displays current market state, band levels, bandwidth percentage, and volatility phase.
- Compatibility: Usable on any symbol (Forex, Crypto, Indices, Stocks) and any timeframe without limitations.
Trading guidance suggests using the dashboard to identify squeeze phases for breakout trades, riding trends within the cloud, and entering on pullbacks to the mid-line for lower-risk entries. The indicator provides visual and signal-based tools to support breakout and trend-following strategies.
지표 프로필
지표 카테고리
변동성
출력 유형
시각화
신호
필터
데이터 요구 사항
막대만
지원되는 신호
추세 강도
변동성
돌파
상담
고객 리뷰
4.5
리뷰: 2
5 | 50 % | |
4 | 50 % | |
3 | 0 % | |
2 | 0 % | |
1 | 0 % |
자주 묻는 질문(FAQ)
Key Levels
Channel
트레이딩 봇, 지표, 플러그인 등 cTrader Store에서 제공되는 상품은 제3자 개발자에 의해 제공되며, 이는 단순히 정보 및 기술적 접근을 목적으로 제공된 것입니다. cTrader Store는 중개인이 아니며, 투자 조언, 개인별 추천 또는 향후 성과에 대한 어떠한 보장도 제공하지 않습니다.








가격
32
판매
992
무료 설치