
Stochastic_advanced
Indicator
Version 1.0, Apr 2026
Windows, Mac
4.2
Reviews: 4

32
Sales
993
Free installs
Description
Stochastic Advanced Cloud & Momentum System (FULL VERSION)
The classic Stochastic Oscillator is a legendary tool for catching market reversals and momentum shifts, but reading two thin, tangled lines at the bottom of your screen can be visually confusing.
The Stochastic Advanced indicator completely revamps this traditional tool. By integrating visual Clouds, a Momentum Histogram, Smart Paintbars, and a Volatility Filter, it transforms the Stochastic into a highly visual, all-in-one momentum trading system.
Key Features of the FULL VERSION:
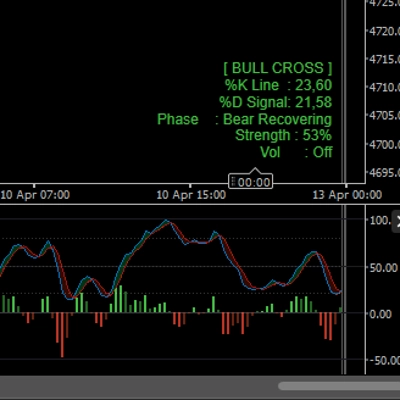
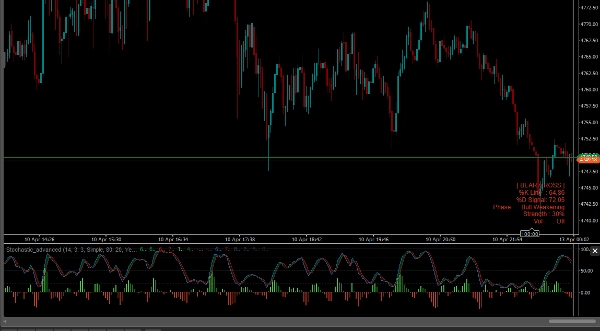
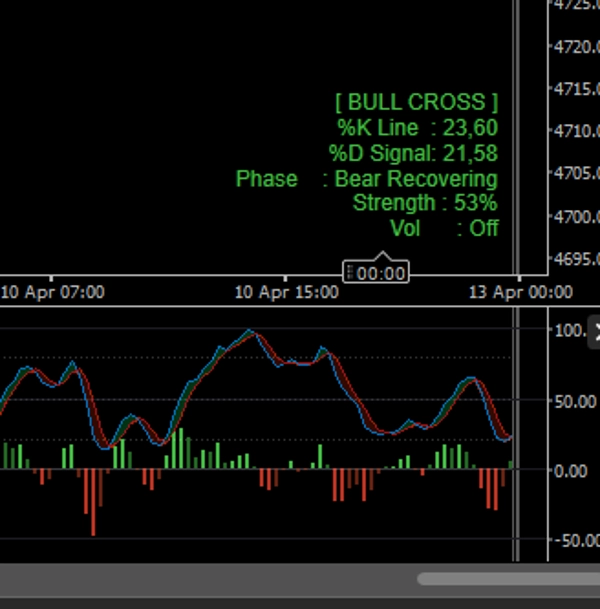
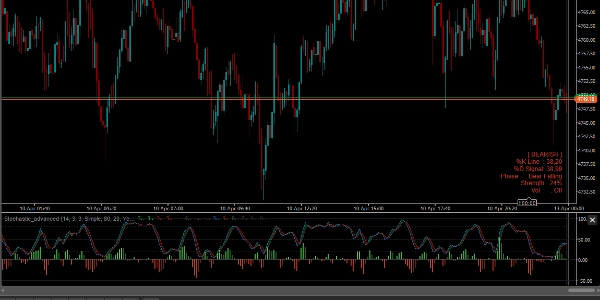
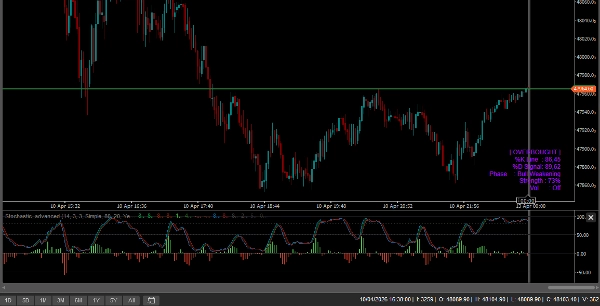
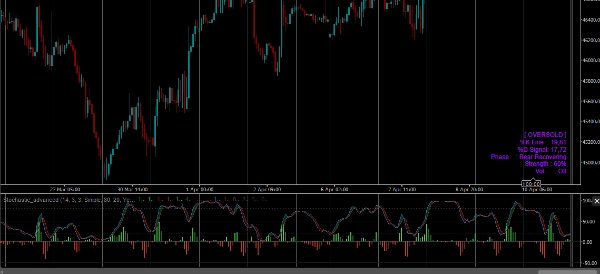
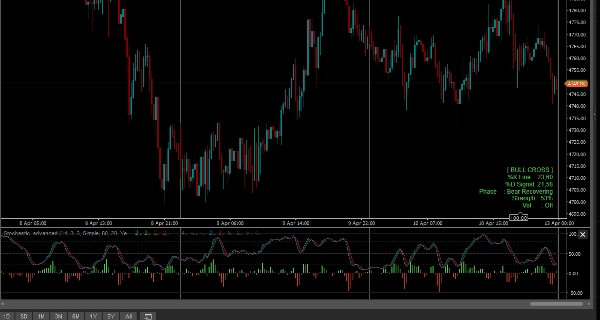
- %K & %D Signal Cloud: The space between the Fast line (%K) and the Slow Signal line (%D) is dynamically filled with a color-coded Cloud. Green Cloud = Bullish crossover. Red Cloud = Bearish crossover. You will never miss a signal again.
- Zero-Line Momentum Histogram: A custom histogram at the bottom of the indicator measures the exact distance between %K and %D. It uses 4-color acceleration/deceleration logic, helping you spot momentum shifts before the lines actually cross.
- Smart Bar Coloring (Paintbars): The indicator directly paints your price candles to match the Stochastic momentum:
- Bright Green/Red: Strong trend alignment (Price is pushing in the direction of the crossover).
- Dark Green/Red: Weak momentum or potential pullbacks.
- Purple/Magenta: Extreme Overbought (OB) or Oversold (OS) levels – alerting you to prepare for a reversal.
- Smart Volatility Filter (ATR): False signals often happen in flat, ranging markets. Enable the built-in ATR Volatility Filter to automatically gray out your candles and histogram when market volatility dies. If it's gray, you stay away!
- Real-Time Info Dashboard: A clean, on-chart panel displays the current Market State, exact %K/%D values, Trend Strength, and Volatility Status at a single glance.
- Completely Unlocked: Trade on ANY symbol (Forex, Crypto, Indices, Stocks) and ANY timeframe with zero limitations. Lifetime access.
How to trade with it?
- The Reversal: Wait for candles to turn Purple (entering Extreme OB/OS zones). Prepare for a trade. Once the Stochastic Cloud flips color (e.g., from Red to Green) and the Histogram accelerates, execute your trade.
- The Trend Continuation: During an active trend, wait for a pullback where %K dips but quickly recovers. A bright histogram bar combined with a brightly colored price candle signals a strong continuation entry.
- Chop Avoidance: If the Volatility Filter turns your bars gray, do not take crossover signals. Wait for the volume and volatility to return
Summary
AI summary
Stochastic Advanced is an enhanced momentum indicator that transforms the classic Stochastic Oscillator into a visually intuitive trading system. It features a dynamic %K and %D Signal Cloud that color-codes bullish and bearish crossovers, making signals easier to identify. A Zero-Line Momentum Histogram uses a four-color scheme to indicate acceleration and deceleration in momentum, helping traders anticipate shifts before line crossovers occur.
The indicator also includes Smart Bar Coloring (paintbars) that visually align price candles with momentum strength and trend direction, using distinct colors to denote strong trends, weak momentum, and extreme overbought or oversold conditions. A built-in Smart Volatility Filter based on Average True Range (ATR) grays out candles and histogram bars during low volatility periods to help avoid false signals in ranging markets.
An on-chart Real-Time Info Dashboard displays current market state, exact %K/%D values, trend strength, and volatility status for quick assessment. The indicator supports all symbols—including Forex, cryptocurrencies, indices, and stocks—and any timeframe without limitations. It is designed for use in reversal and trend continuation strategies while providing chop avoidance through volatility filtering.
The indicator also includes Smart Bar Coloring (paintbars) that visually align price candles with momentum strength and trend direction, using distinct colors to denote strong trends, weak momentum, and extreme overbought or oversold conditions. A built-in Smart Volatility Filter based on Average True Range (ATR) grays out candles and histogram bars during low volatility periods to help avoid false signals in ranging markets.
An on-chart Real-Time Info Dashboard displays current market state, exact %K/%D values, trend strength, and volatility status for quick assessment. The indicator supports all symbols—including Forex, cryptocurrencies, indices, and stocks—and any timeframe without limitations. It is designed for use in reversal and trend continuation strategies while providing chop avoidance through volatility filtering.
Indicator profile
Indicator category
Volatility
Output type
Signals
Filter
Data requirements
Bars only
Supported signals
Trend strength
Volatility
Discussion
Customer reviews
4.2
Reviews: 4
5 | 25 % | |
4 | 75 % | |
3 | 0 % | |
2 | 0 % | |
1 | 0 % |
Customer reviews
April 26, 2026
The first thing that worked was the signal needs a real reason behind it, and the first test should keep DD under 3 percent.
April 24, 2026
What stood out was confusing signals get easier to ignore. Strong trends can keep readings stretched.
April 15, 2026
The logic holds up when bad ideas get easier to avoid, and Overconfidence is the real danger.
April 12, 2026
FAQ
ATR
Stochastic
Products available through cTrader Store, including trading bots, indicators and plugins, are provided by third-party developers and made available for informational and technical access purposes only. cTrader Store is not a broker and does not provide investment advice, personal recommendations or any guarantee of future performance.





























Price
32
Sales
993
Free installs