present
Sign up and get $50 off your first purchase
Trading product for WT - Tick Run Bars Indicator BTCUSD Forex, image 1
WT - Tick Run Bars
Indicator
Version 1.0, Nov 2025
Windows, Mac
Trading product for WT - Tick Run Bars Indicator BTCUSD Forex, image 2
Trading product for WT - Tick Run Bars Indicator BTCUSD Forex, image 3
95.65M
Traded volume
143.01K
Pips won
88
Sales
514
Free installs

Description

TRB — Tick Runs Bars Indicator

Detect Market Information Before Price Moves

Limited-time introductory pricing for early adopters - secure your copy now at a reduced rate before the price increases to standard retail pricing once the initial release period ends.


Version 1.1
Use Comments Section to ask for more details
Available for Video Session with Setup Guide after Purchase


TICK RUNS BARS (TRB) INDICATOR

Tick Runs Bars extends market microstructure analysis by detecting directional persistence in trading flow. Also rooted in Marcos López de Prado's Advances in Financial Machine Learning, this indicator identifies when one-sided market pressure deviates from expected levels — revealing institutional order slicing and coordinated trading activity.

The Core Insight

Institutional traders execute large orders strategically — they slice them into smaller pieces, hide volume behind iceberg orders, or use algorithmic execution to avoid moving the market. These tactics leave distinct fingerprints in the form of persistent one-directional trading runs. Tick Runs Bars detect these patterns by measuring how long one side dominates the order flow, revealing when deliberate, aggressive ordering is occurring rather than random price fluctuations.

How It Works

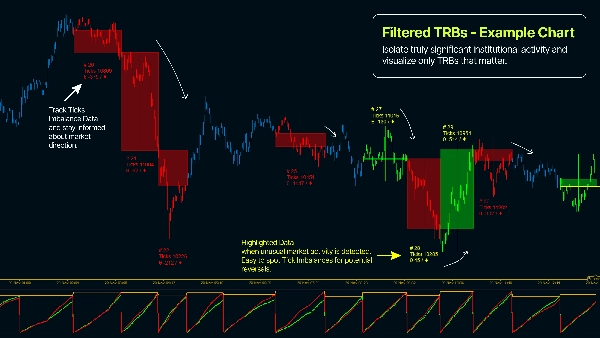
The indicator calculates the length of buy-run volumes and sell-run volumes separately — not netting them against each other like traditional imbalance metrics. It tracks the maximum one-sided volume accumulation (θT) against a dynamic expected threshold derived from historical buy/sell probability and average volumes. When actual directional runs exceed expectations, a new TRB bar is triggered. This reveals the "structural shape" of order flow execution — the signature of institutional players at work.

Key Features

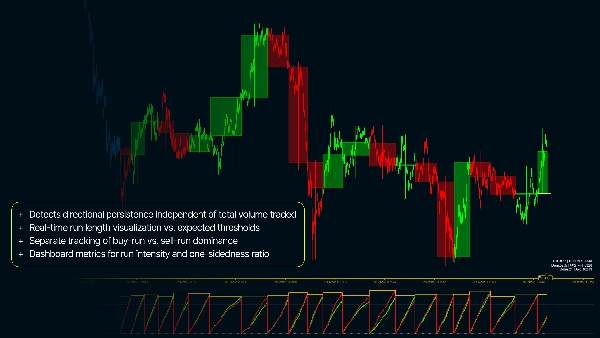
  • Detects directional persistence independent of total volume traded
  • Real-time run length visualization vs. expected thresholds
  • Separate tracking of buy-run vs. sell-run dominance
  • Chart candle coloring by TRB membership showing order execution phases
  • Min Volume Filter to isolate truly significant institutional activity
  • Dashboard metrics for run intensity and one-sidedness ratio
  • Configurable Expected Bar Size and EWMA parameters adapted to instrument volatility

Why Use Tick Runs Bars?

  • Identify institutional order execution in real-time — before completion
  • Detect hidden liquidity and iceberg order patterns through flow analysis
  • Distinguish coordinated trading from random market noise
  • Capture price movement from structural order imbalances, not just statistical anomalies
  • Time entries/exits during periods of known institutional participation
  • Apply advanced market microstructure theory to gain edge on faster timeframes
  • Reduce false signals from minor retail trading spikes

Summary

AI summary
WT - Tick Run Bars (TRB) is an indicator designed for market microstructure analysis that detects directional persistence in trading flow. It identifies when one-sided market pressure exceeds expected levels, revealing institutional order execution tactics such as order slicing, iceberg orders, and coordinated trading activity. The indicator separately measures the length of buy-run and sell-run volumes, comparing them to dynamic thresholds based on historical probabilities and average volumes. When these directional runs surpass expectations, a new TRB bar is generated, highlighting phases of aggressive order flow.

Key features include real-time visualization of run lengths versus expected thresholds, separate tracking of buy and sell dominance, candle coloring by TRB membership to indicate order execution phases, and a minimum volume filter to focus on significant institutional activity. The indicator also provides dashboard metrics for run intensity and one-sidedness ratio, with configurable parameters adapted to instrument volatility.

TRB supports analysis across various markets and symbols, including Forex, stocks, commodities, indices, and cryptocurrencies such as BTCUSD, EURUSD, GBPUSD, and XAUUSD. It is intended to help traders identify institutional participation in real-time, detect hidden liquidity patterns, distinguish coordinated trading from noise, and time entries and exits during significant market activity.
Indicator profile

Customer reviews

0.0
Reviews: 0
Customer reviews
No reviews for this product yet. Already tried it? Be the first to tell others!

Discussion

FAQ

BTCUSD
Forex
Signal
Breakout
Indices
EURUSD
Commodities
GBPUSD
NZDUSD
Prop
Scalping
Crypto
Stocks
XAUUSD
NAS100
USDJPY
Products available through cTrader Store, including trading bots, indicators and plugins, are provided by third-party developers and made available for informational and technical access purposes only. cTrader Store is not a broker and does not provide investment advice, personal recommendations or any guarantee of future performance.

More from this author

Indicator
Prop
Forex
+12
Lightweight Risk-Reward Visualization Tool.
Desktop plugin
Forex
Crypto
+3
Build custom second and tick charts using adjustable bar sampling intervals.
Desktop plugin
Stocks
Indices
+1
Build custom charts based on specific trading sessions.
cBot
Fixed Risk %
No Overtrading
+5
Turn Your Keyboard into a Trading Console — Instant Entries, Exits, and Precision Risk Control.
Indicator
Forex
Crypto
+5
Experience a new approach with amplitude-based momentum analysis. Smart Trend Detection That Adapts to Market Volatility
Indicator
Key Levels
Supertrend
+1
A cTrader indicator for clear trend direction, entry timing, and on-chart risk visualization.
Indicator
Imbalance
Key Levels
+2
A Next-Generation Adaptive Oscillator with Z-Score Regime Engine.
Indicator
Forex
Crypto
+5
This indicator combines two independent analytical engines into a single overlay on your chart.
Desktop plugin
Chart UI Tools
Trend Reversal (TRev) charts plot candlesticks according to the distance price moves, not the passage of time.
Indicator
Imbalance
Order Block
+5
Spot the moments when price and order flow disagree - across every timeframe, at a glance.
Indicator
ATR
Supertrend
+5
Read price differently. Measure what the market actually does.
cBot
Fixed Lot
Supertrend
+5
Find the settings. Validate the strategy.
2.2
Profit factor

You may also like

Indicator
EMA
Forex
+5
ALMA Smoothed Gaussian Moving Average (ASGMA) – by LudwigICT
Indicator
ADX
ATR
+5
SuperTrend signals scored on five confluence factors, with an ATR stop, three targets and a dashboard.
Indicator
Forex
EURUSD
+3
ATR-normalized MA slope in degrees, comparable across all instruments. Color-coded labels flag strong trend moves.
Indicator
Key Levels
Liquidity Sweep
+2
Complete intraday market structure tool tracking session killzones, Asian range projections, and PDH/PDL levels.
Indicator
Volume
Channel
+3
A higher-timeframe log-regression channel with a volume profile, Point of Control and session levels.
Indicator
SMC
Prop
+5
Order Block PRO — Smart Institutional Zone Detector
Indicator
Forex
Indices
+1
Professional Fair Value Gaps with multitimeframe spot on
Indicator
ATR
Volume
+2
Heatmap Liquidity Zones Visualize volume-at-price, uncover hidden support/resistance, and track market liquidity in real
Indicator
BOS
CHOCH
+5
MarketStructurePro – Smart BOS/CHoCH
Indicator
ATR
SMC
+18
Precision SMC tool with HTF sweeps, MSS confirmation & smart FVG detection for high-probability reversals.
Indicator
Area of Interest with the power of AI to detect the market interest.
Indicator
ATR
Forex
+5
🚀 Buy and sell signals 📈📉 only when three independent engines agree simultaneously.
Indicator
Prop
Forex
+11
🧭 See when your market tends to move—by Month, Day-of-Week, or Hour-of-Day🧭
Indicator
SMC
Prop
+12
Multi-TF FVG + Smart Fibonacci
Indicator
ADX
ATR
+5
Ten confluence layers scored on every closed bar, with an anti-chop gate, pivot levels and a live dashboard.
Indicator
EMA
SMA
+5
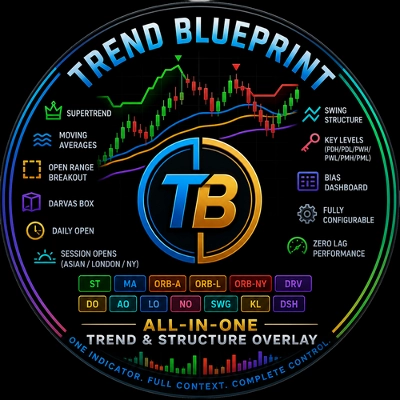
Trend Blueprint All-in-One Trend & Structure
Indicator
ATR
EMA
+5
Multi-factor volatility squeeze detector, dual-trend scoring & breakout validation dashboard. No repaint.
Indicator
MSS
VWAP
+5
VWAP mean-reversion signals combined with a ribbon-anchored volume profile, VAH/VAL, POC and HVN levels.

Price

95.65M
Traded volume
143.01K
Pips won
88
Sales
514
Free installs