Indicator
Indices
Forex
USDJPY
JPYX w HMA
"JPYX w HMA" logo
03/09/2025
28
Desktop
"JPYX w HMA" uploaded image"JPYX w HMA" uploaded image

Introducing the Historical JXY Yen Index Indicator – the ultimate tool for gauging the strength of the Japanese Yen against major currencies. This advanced cTrader indicator synthesizes data from six key Yen pairs (EURJPY, GBPJPY, AUDJPY, NZDJPY, CADJPY, USDJPY) with customizable weightings to deliver a comprehensive, real-time picture of Yen performance.

Key Features:

  • Comprehensive Currency Blend:
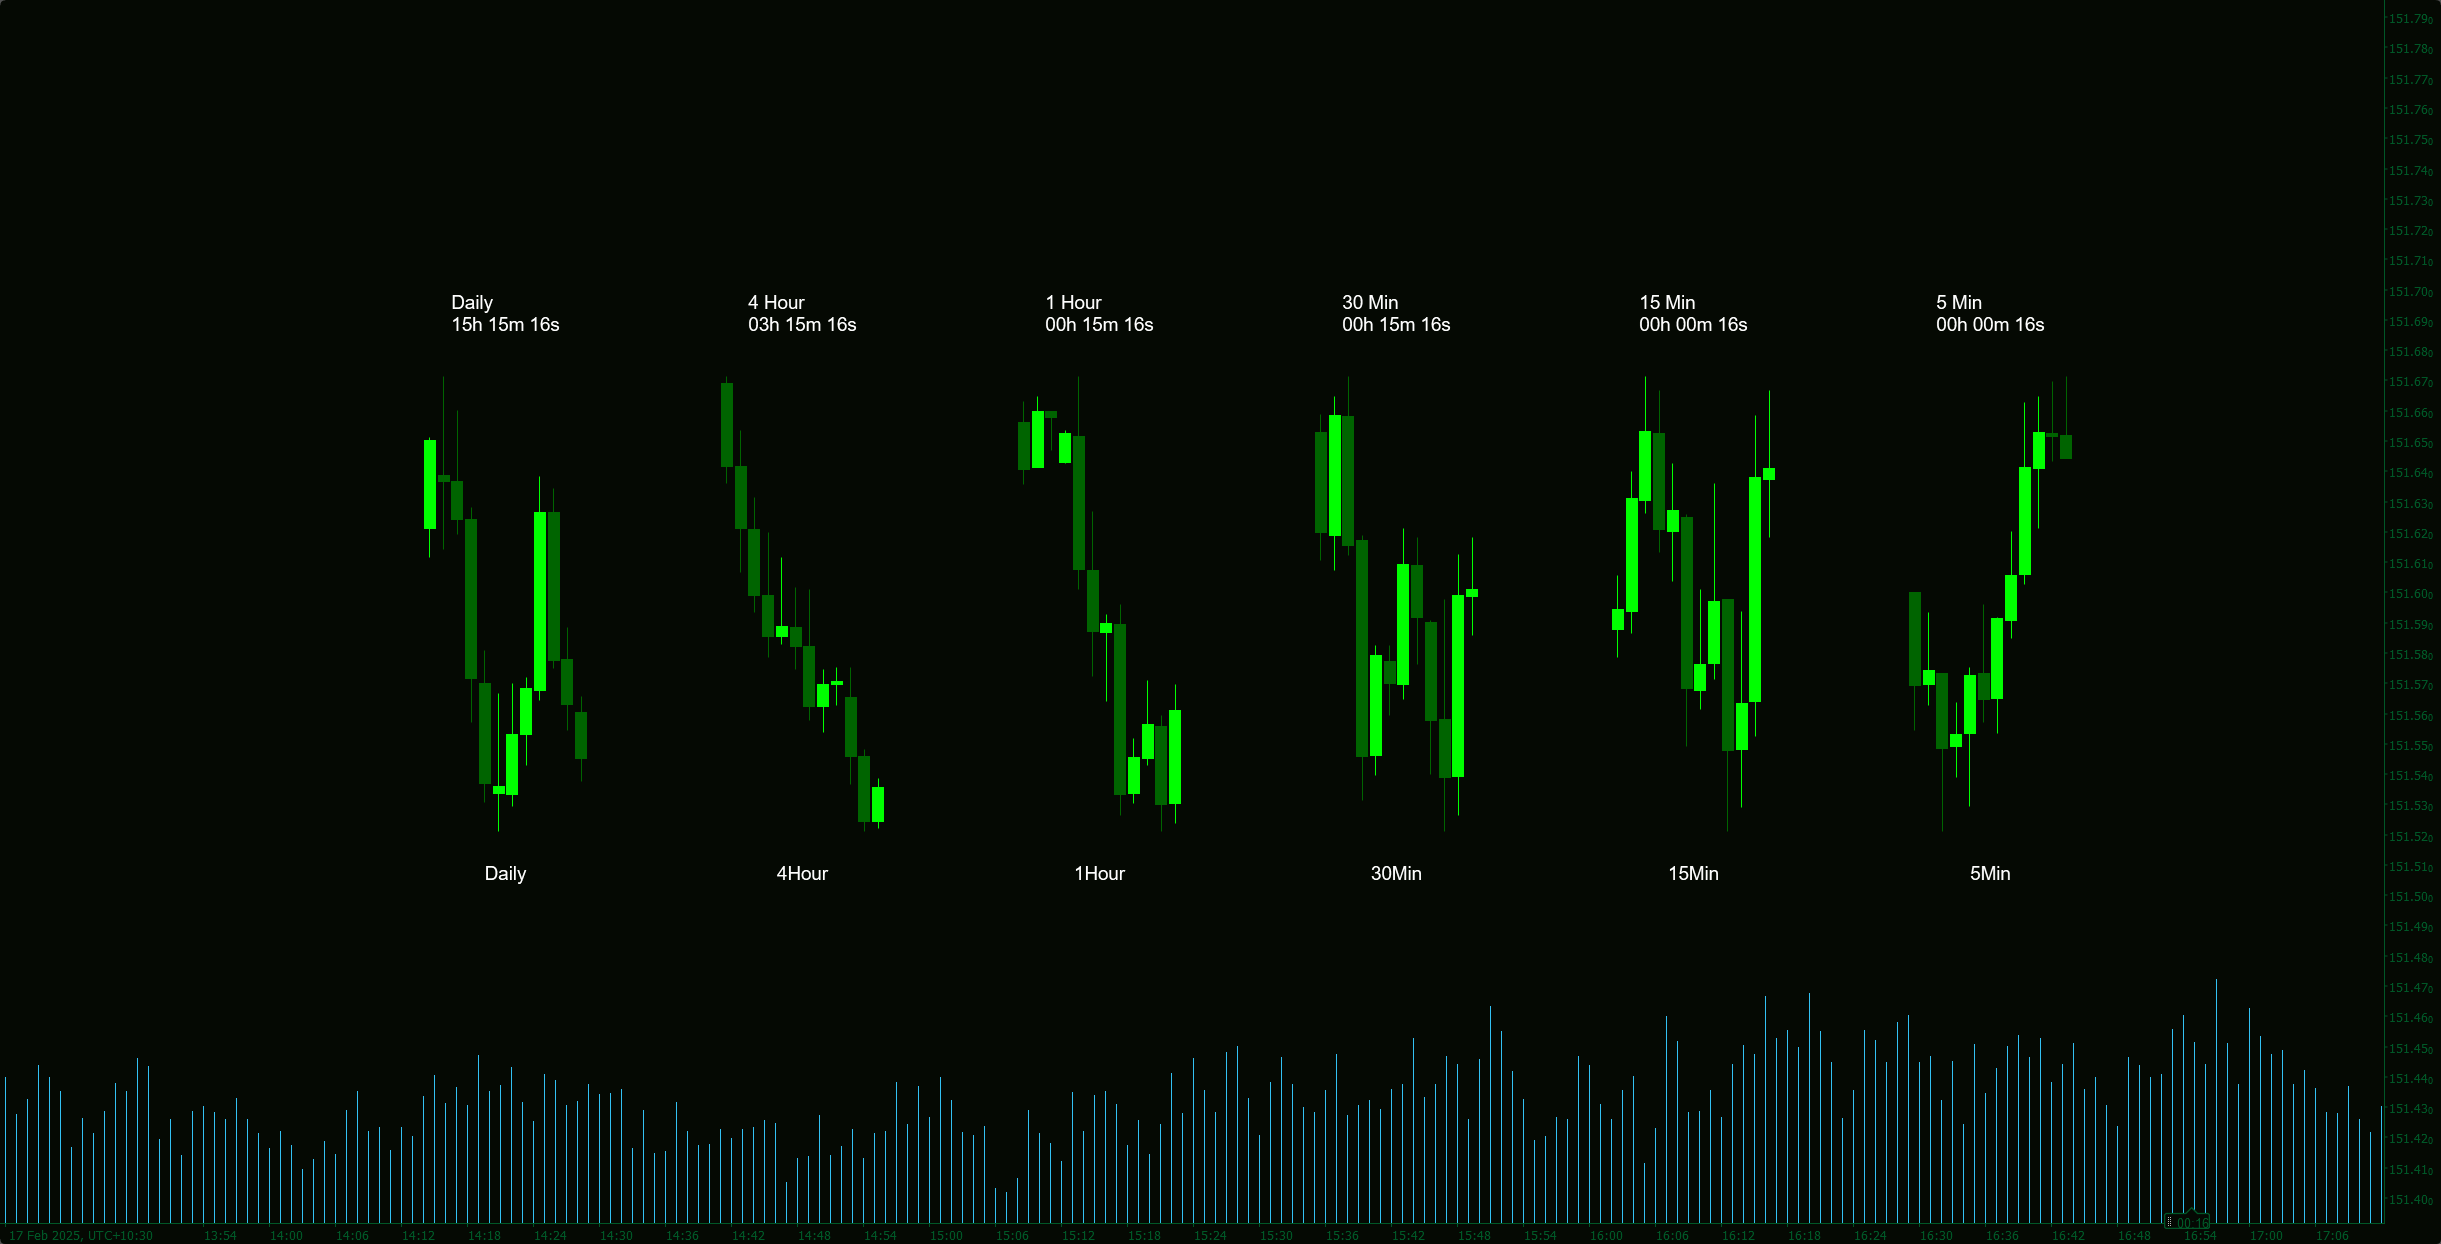
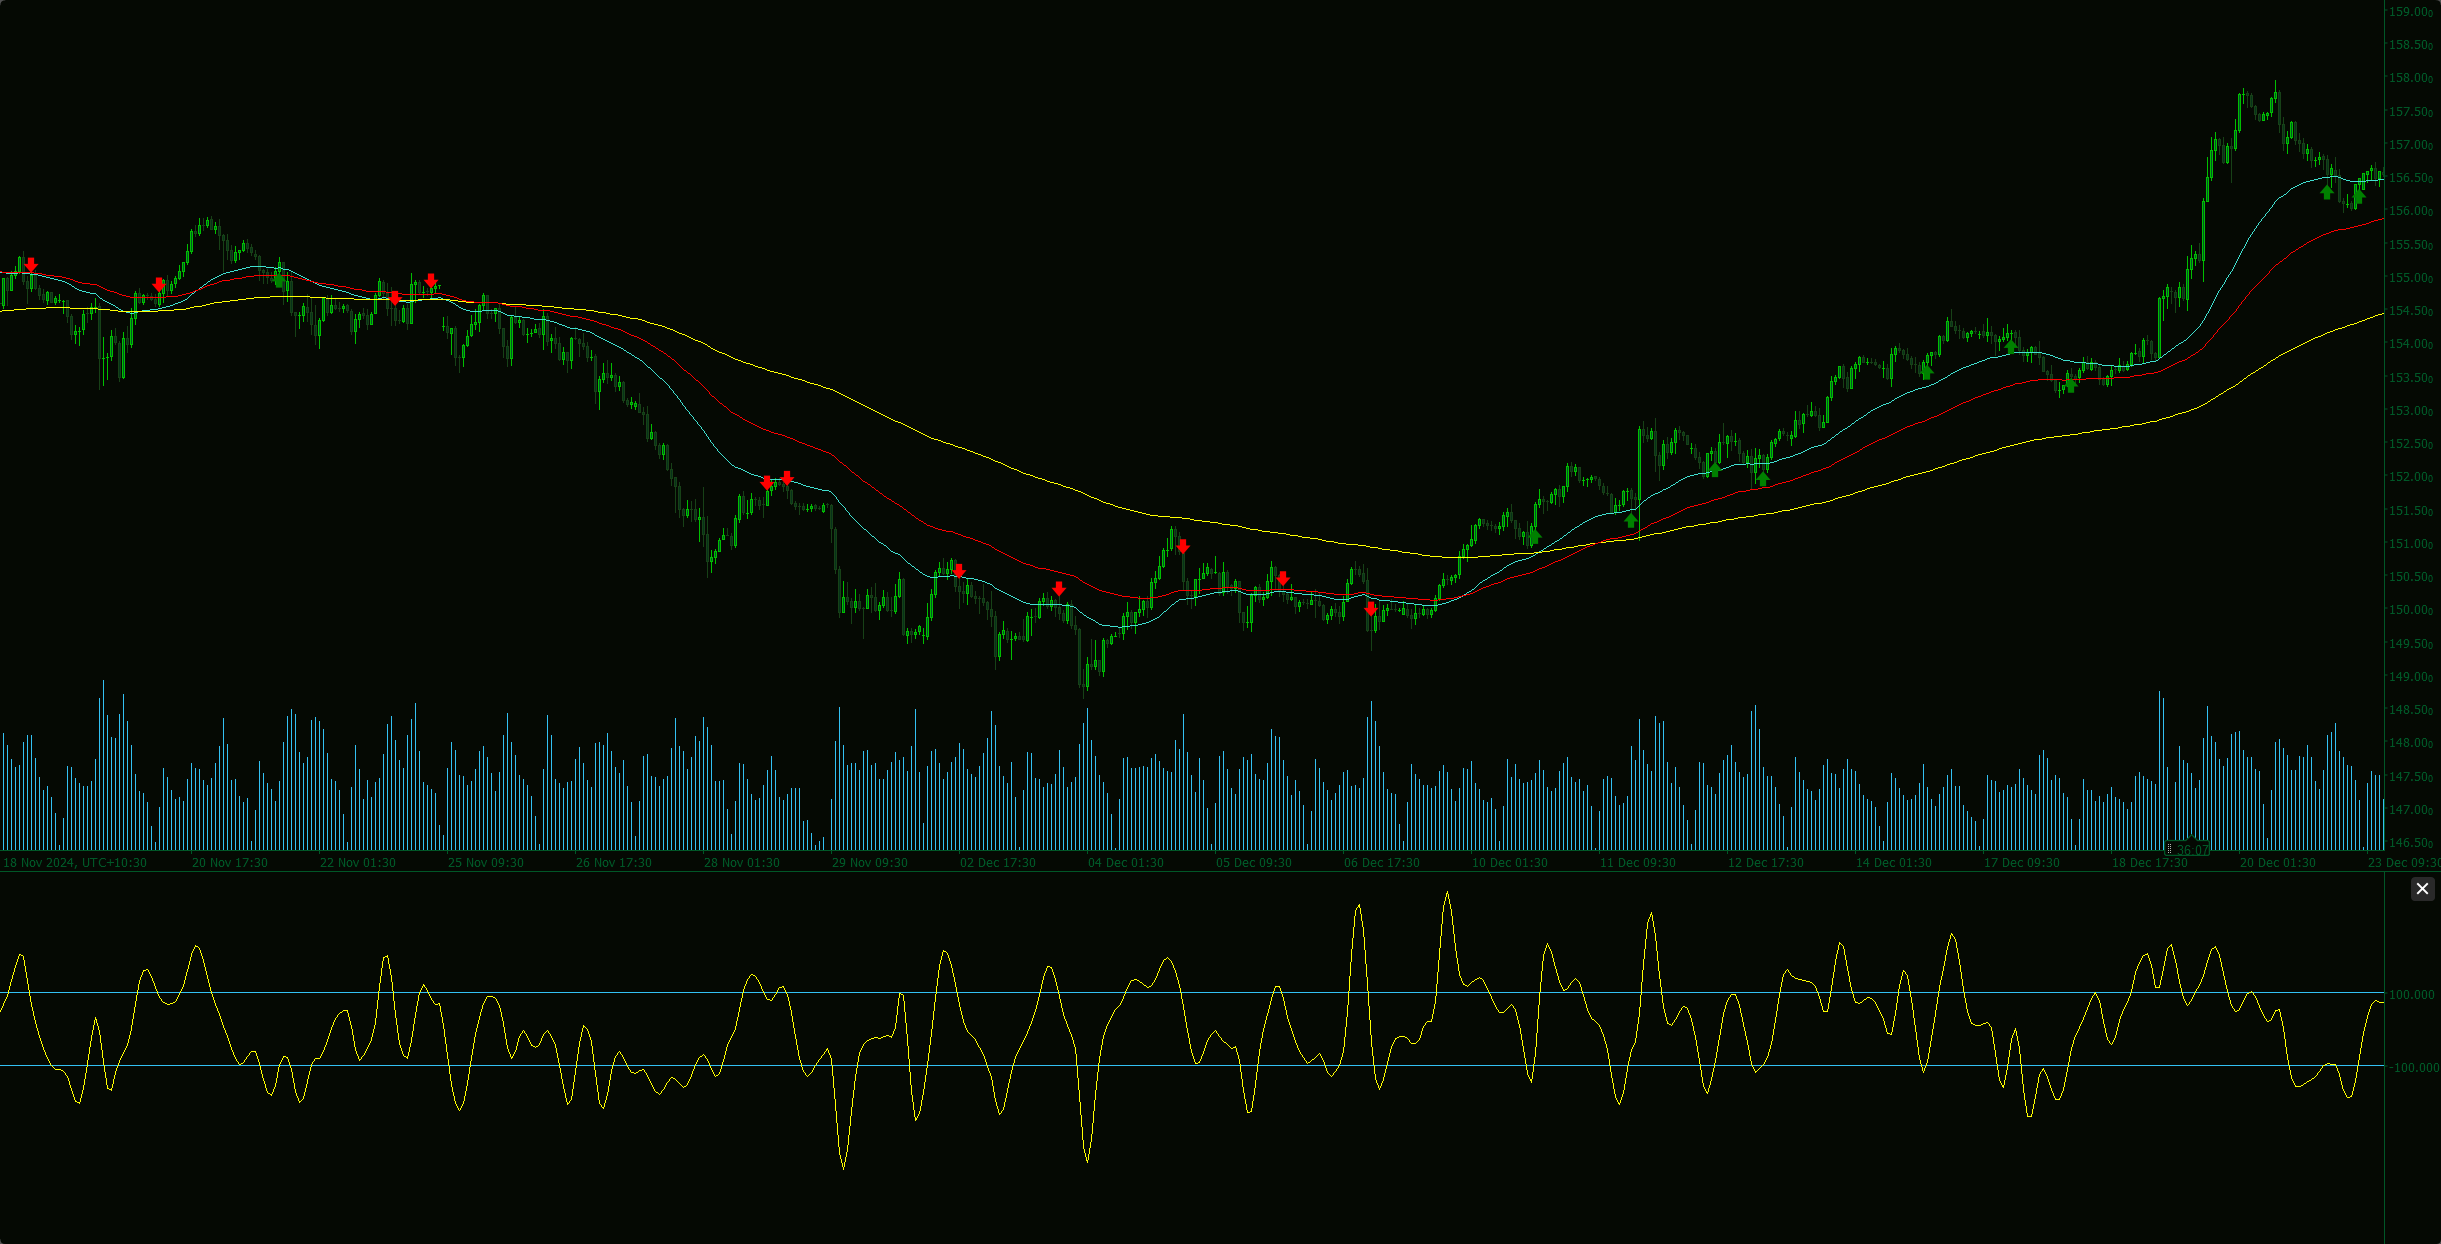
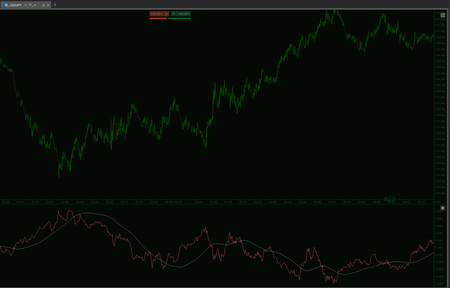
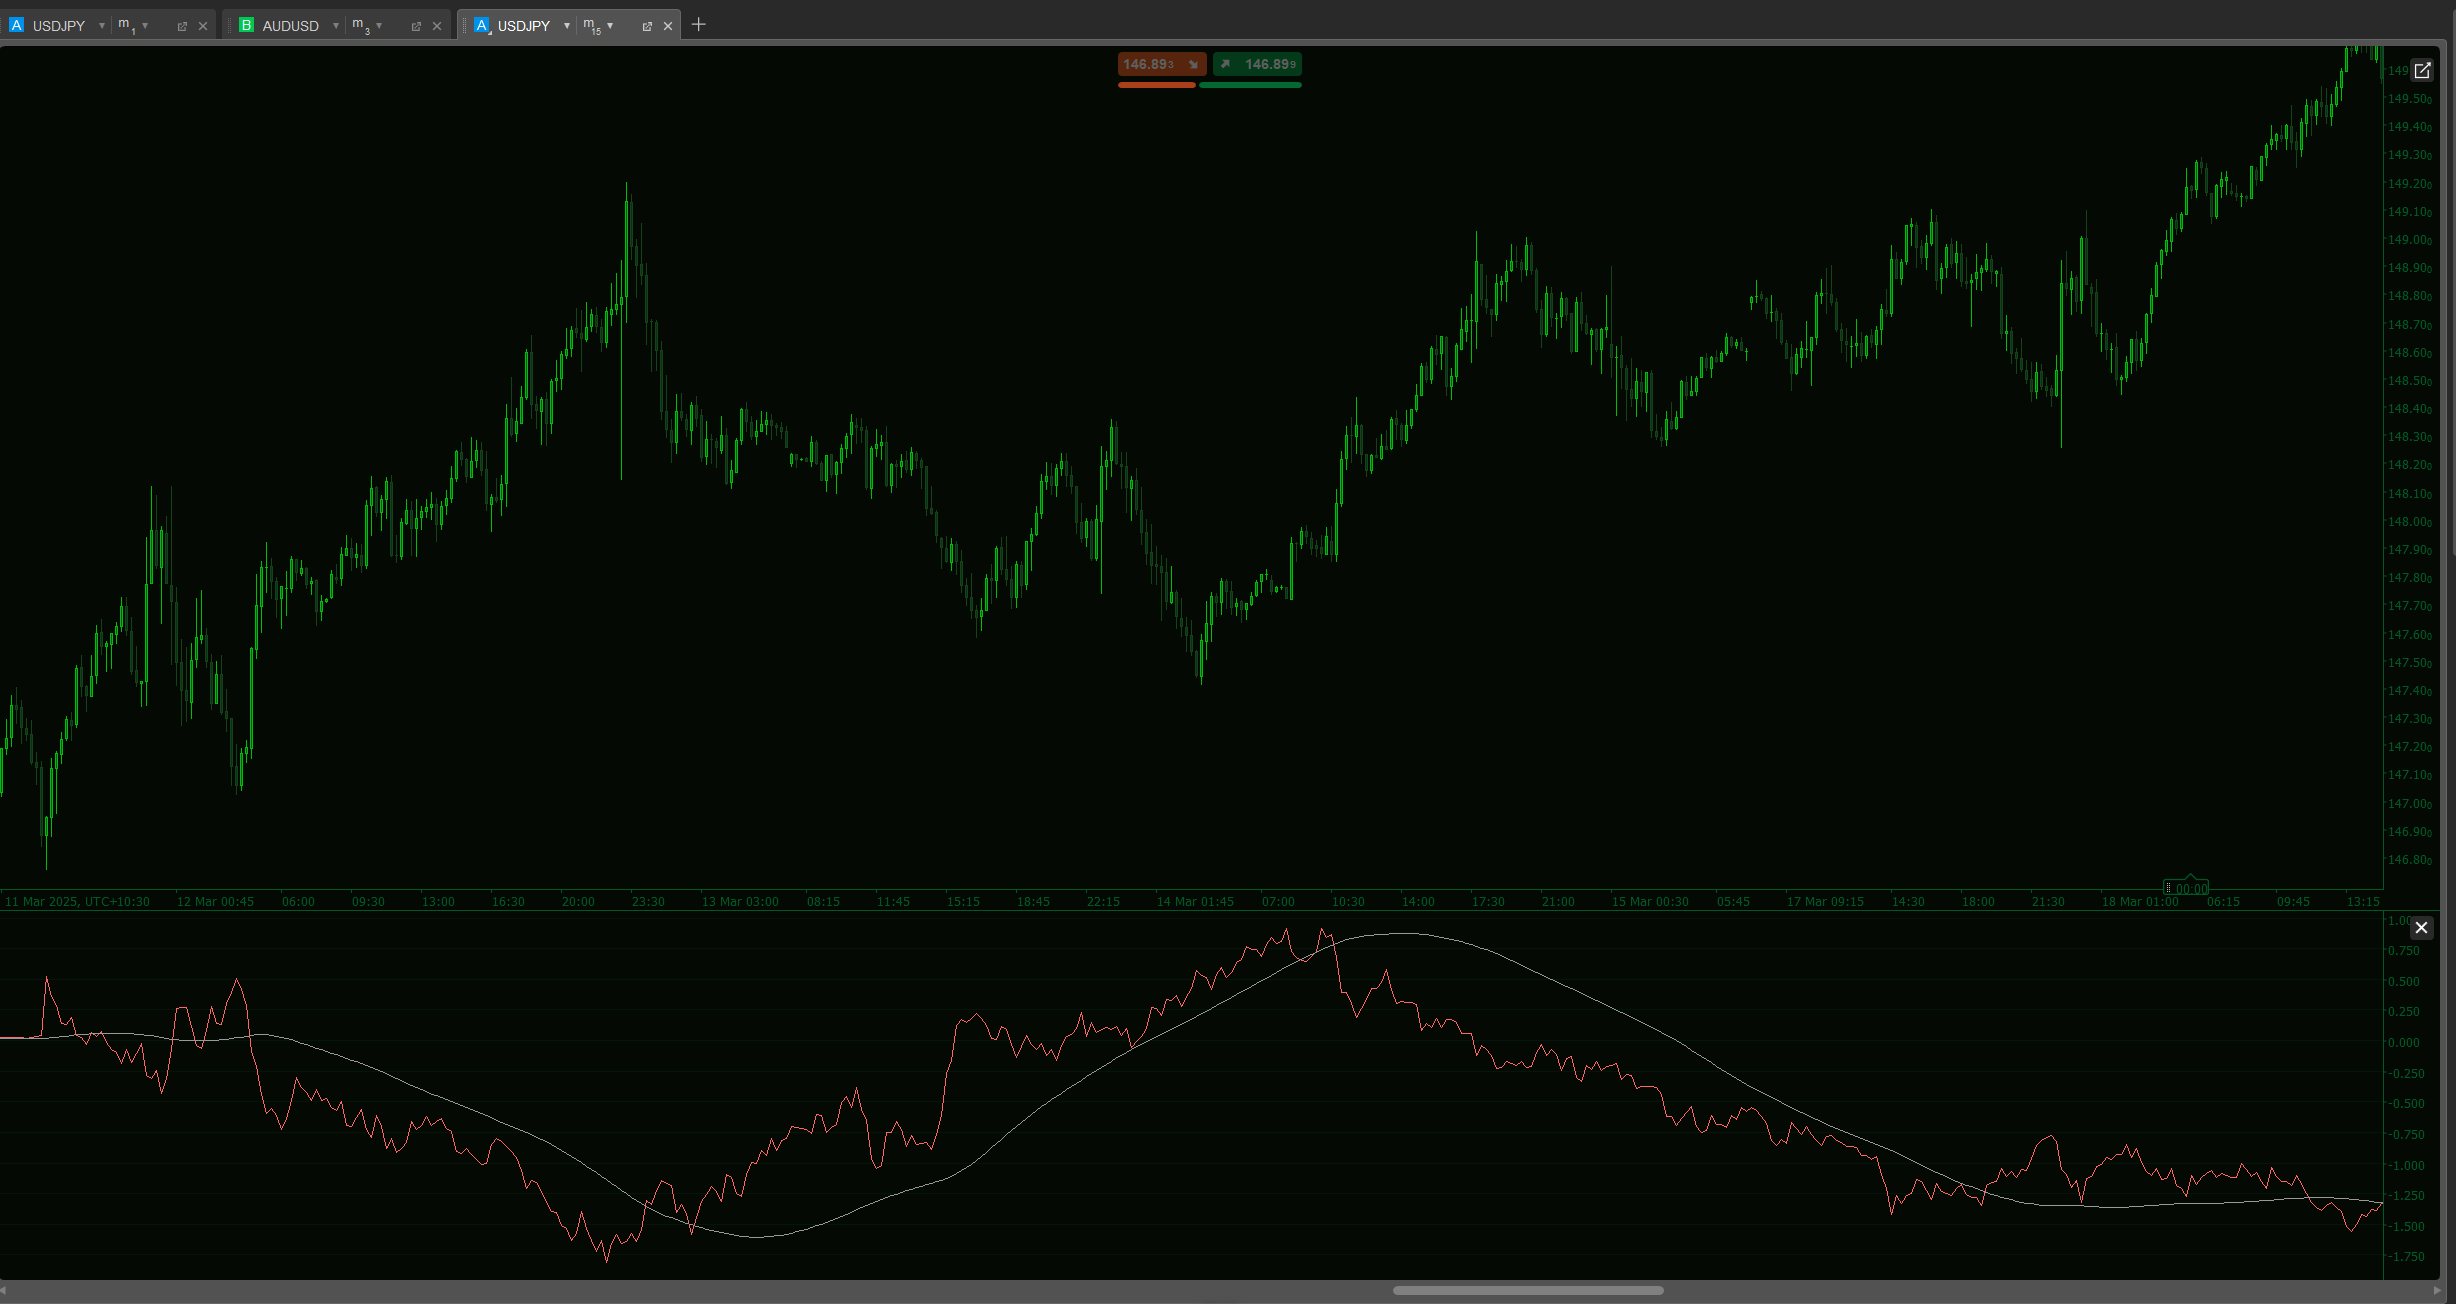
    Integrates six pivotal Yen pairs, each weighted to reflect their market impact. The inverted percentage change mechanism ensures that as a pair strengthens against the Yen, its contribution accurately signals the Yen’s overall performance.
  • Multi-Layered Trend Analysis:
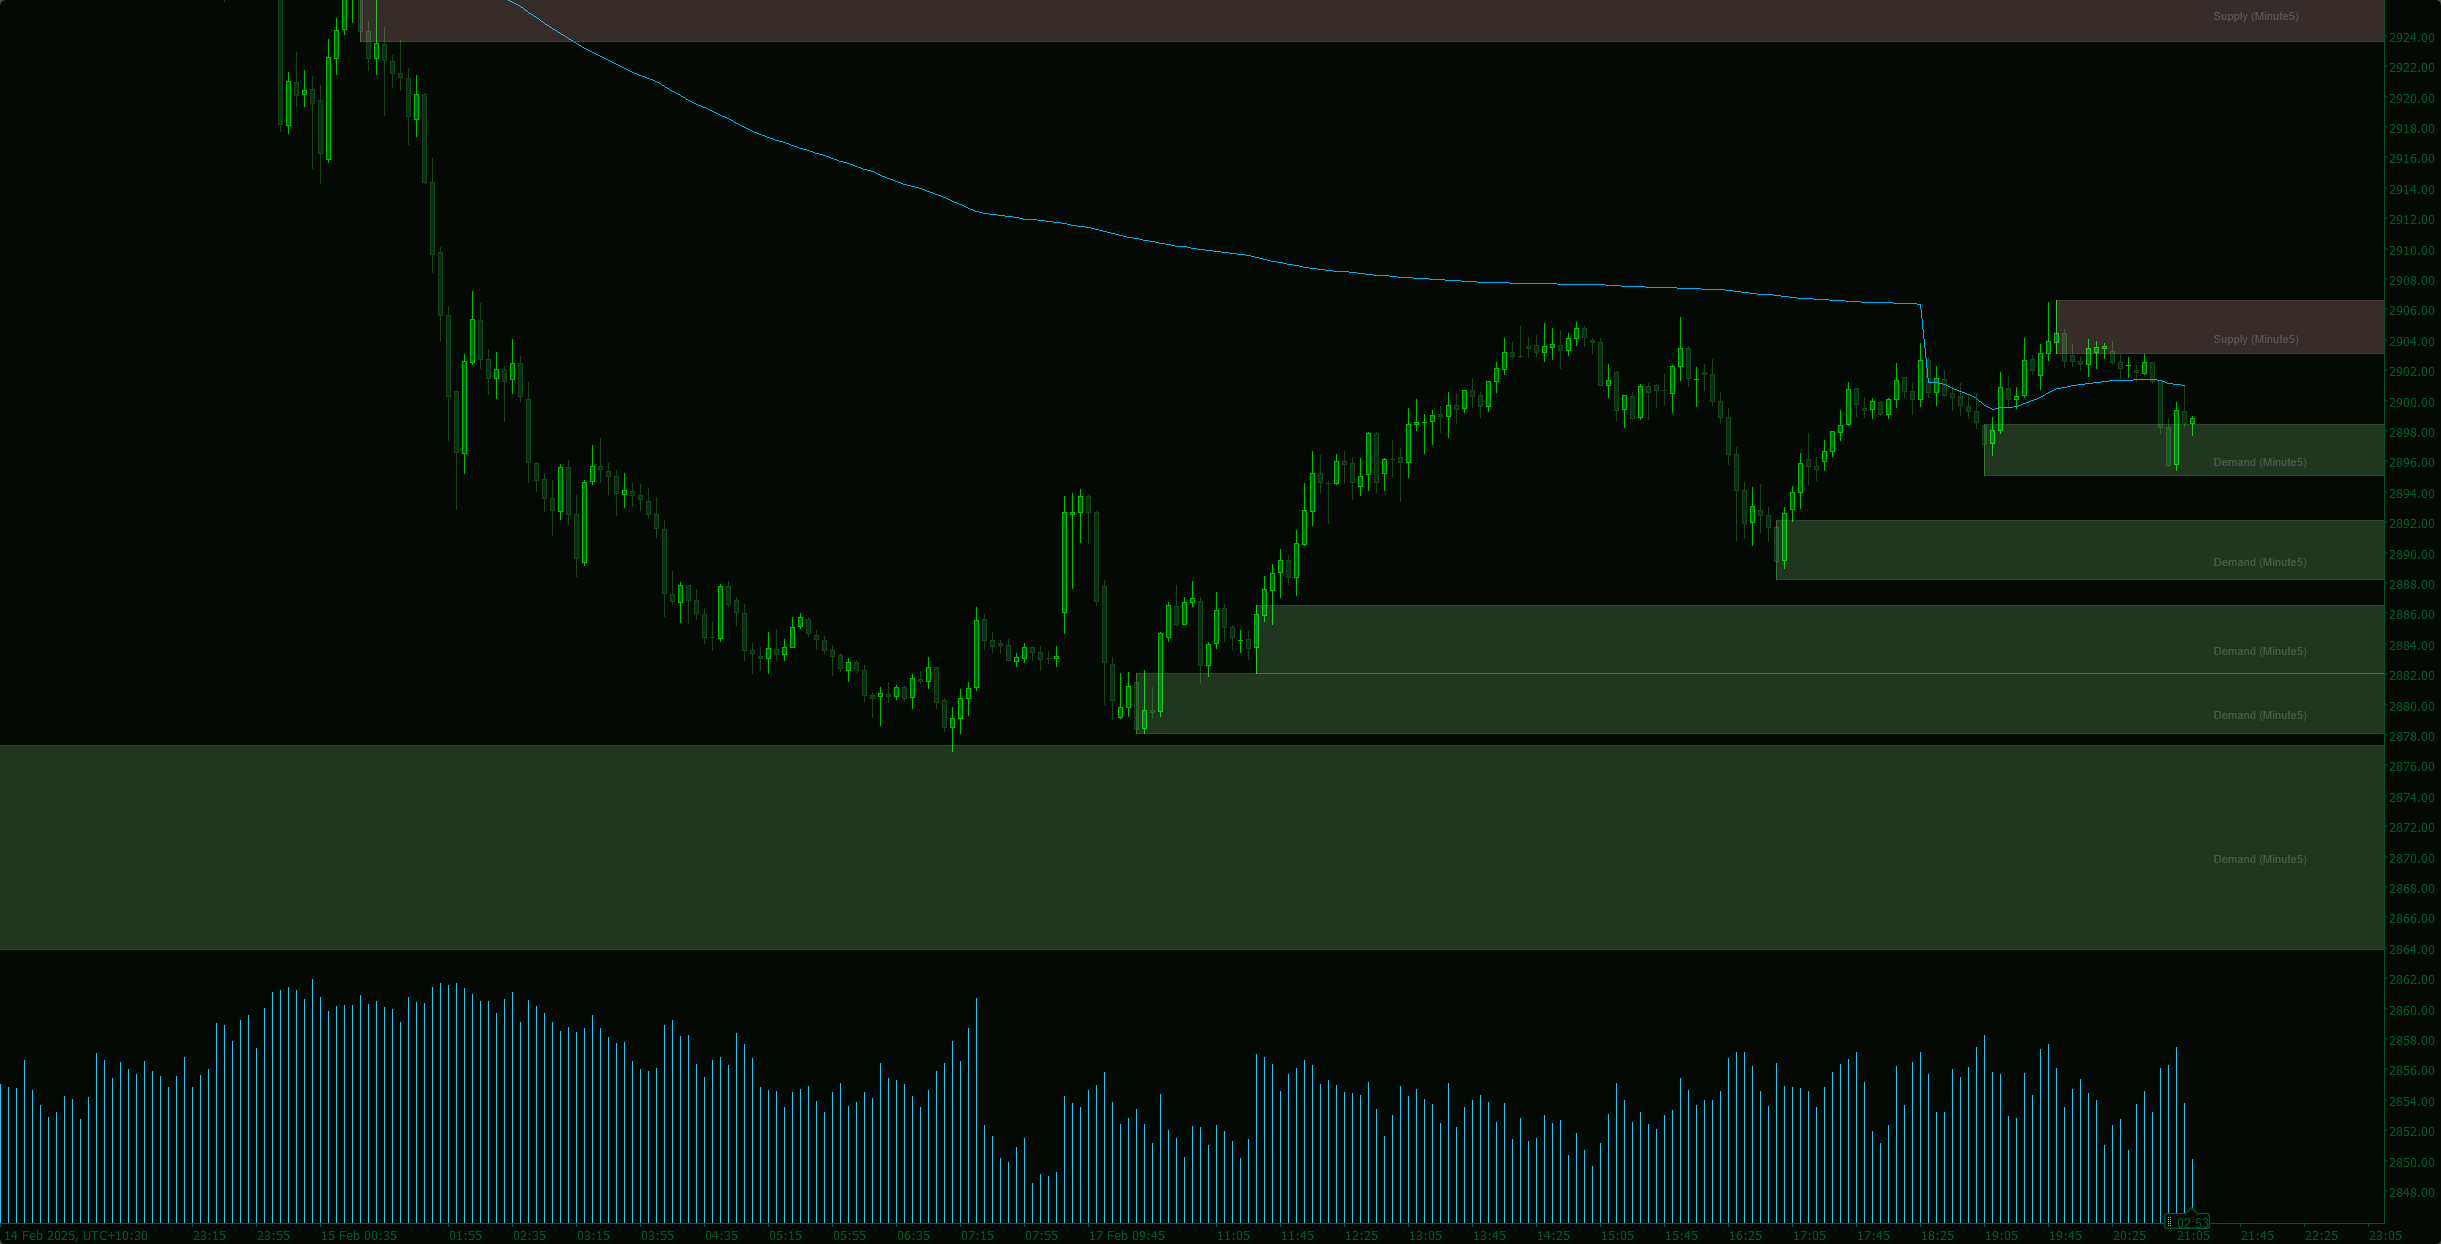
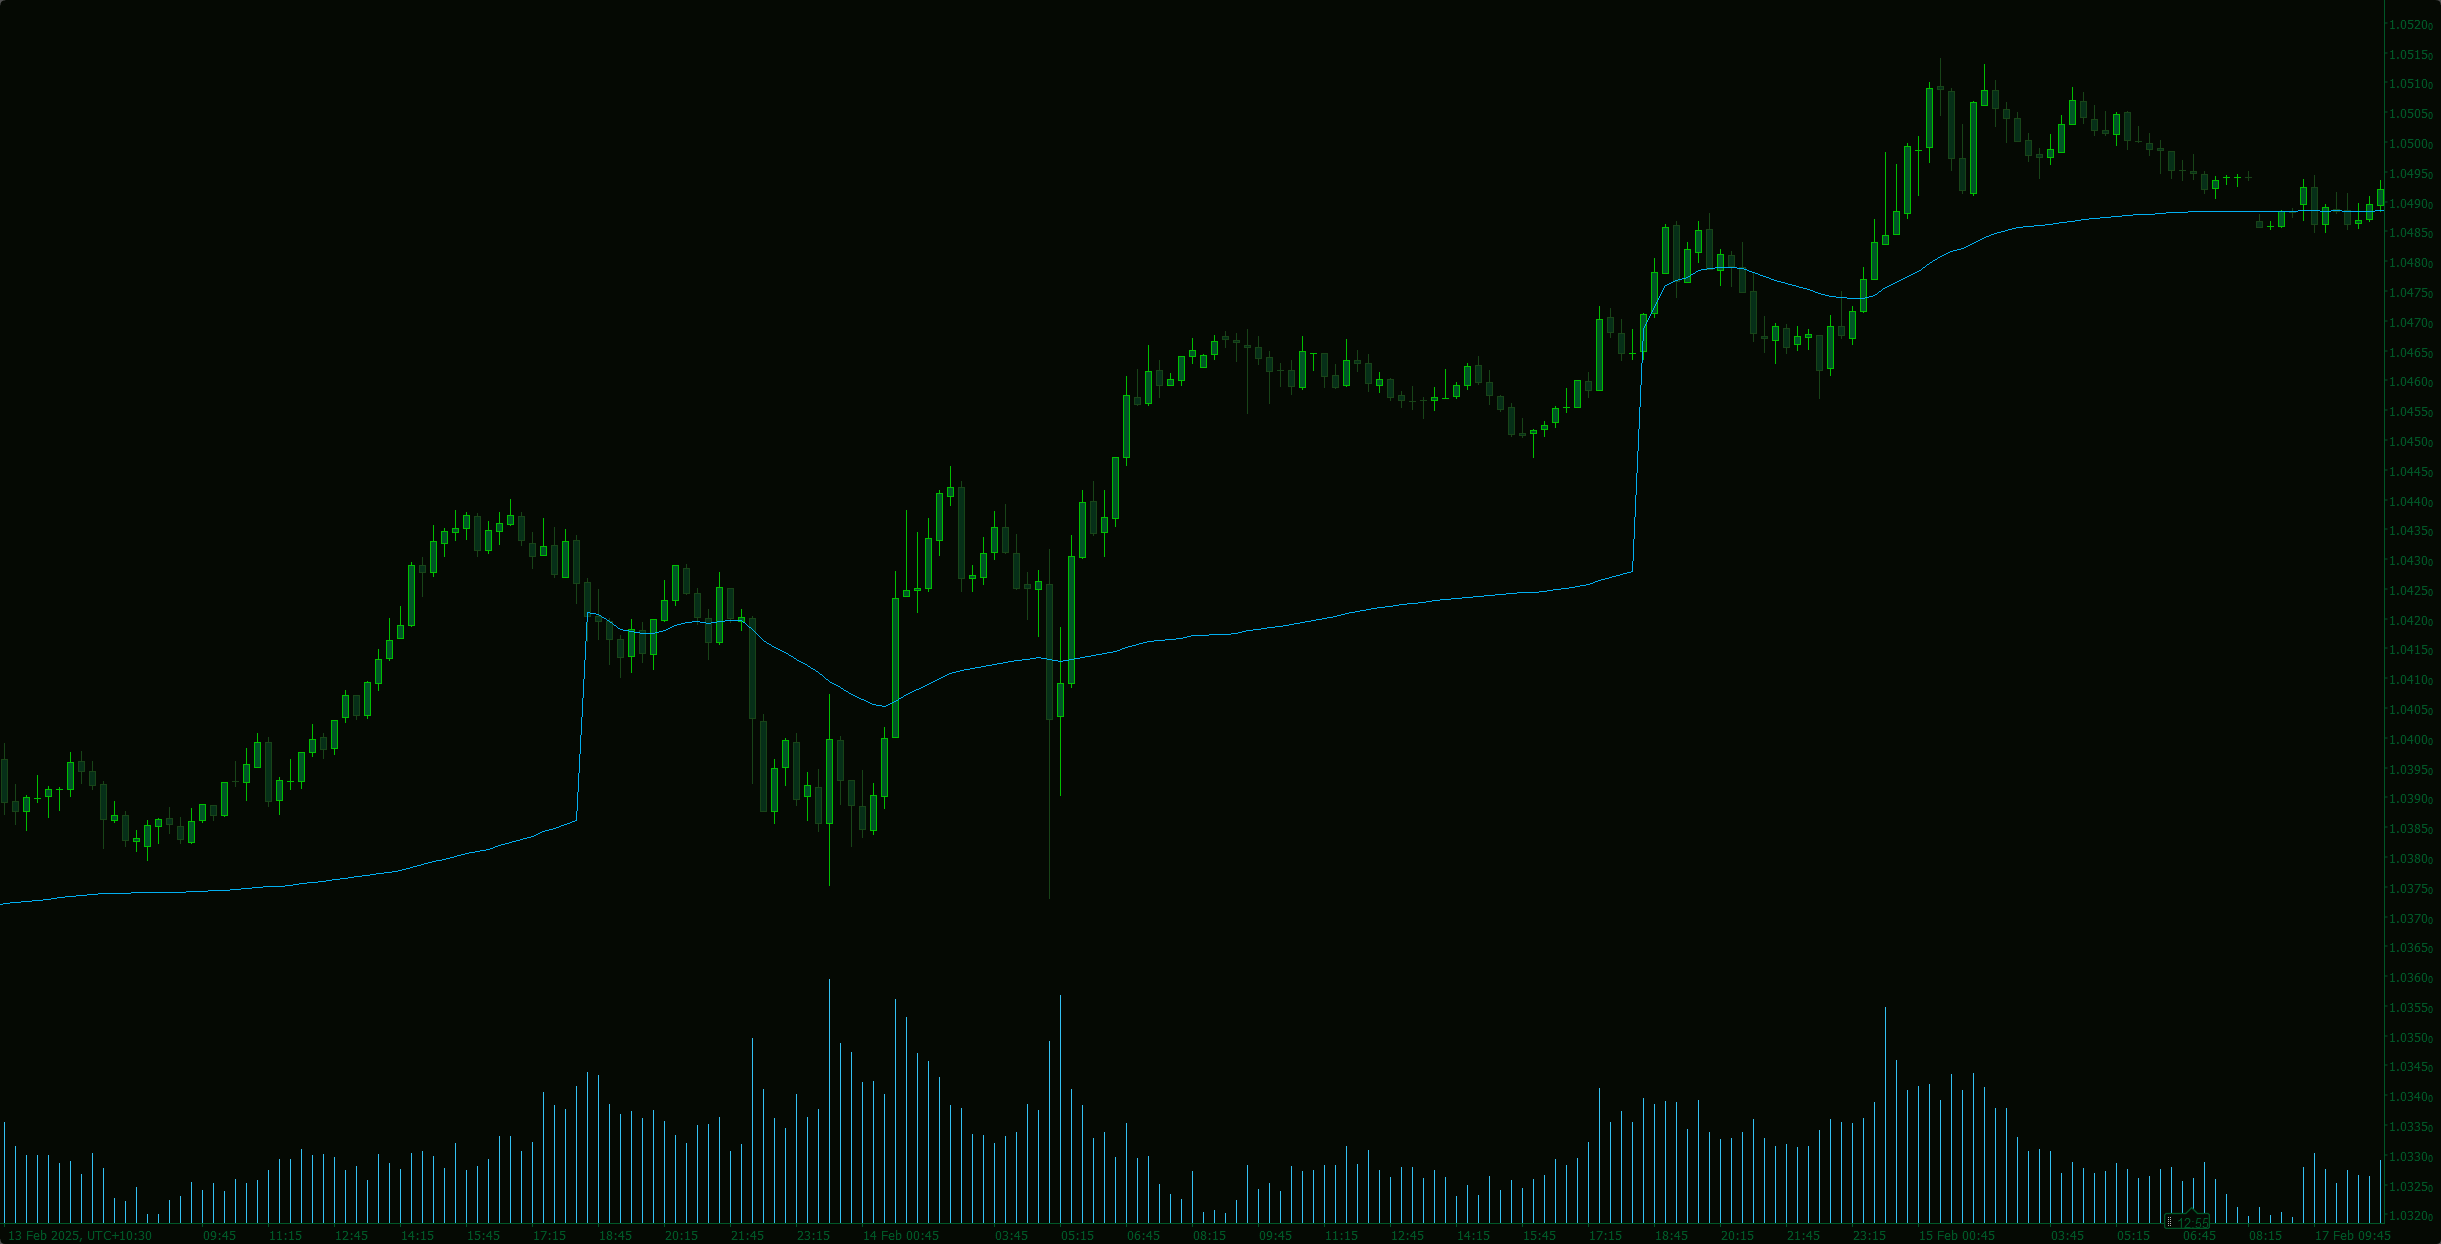
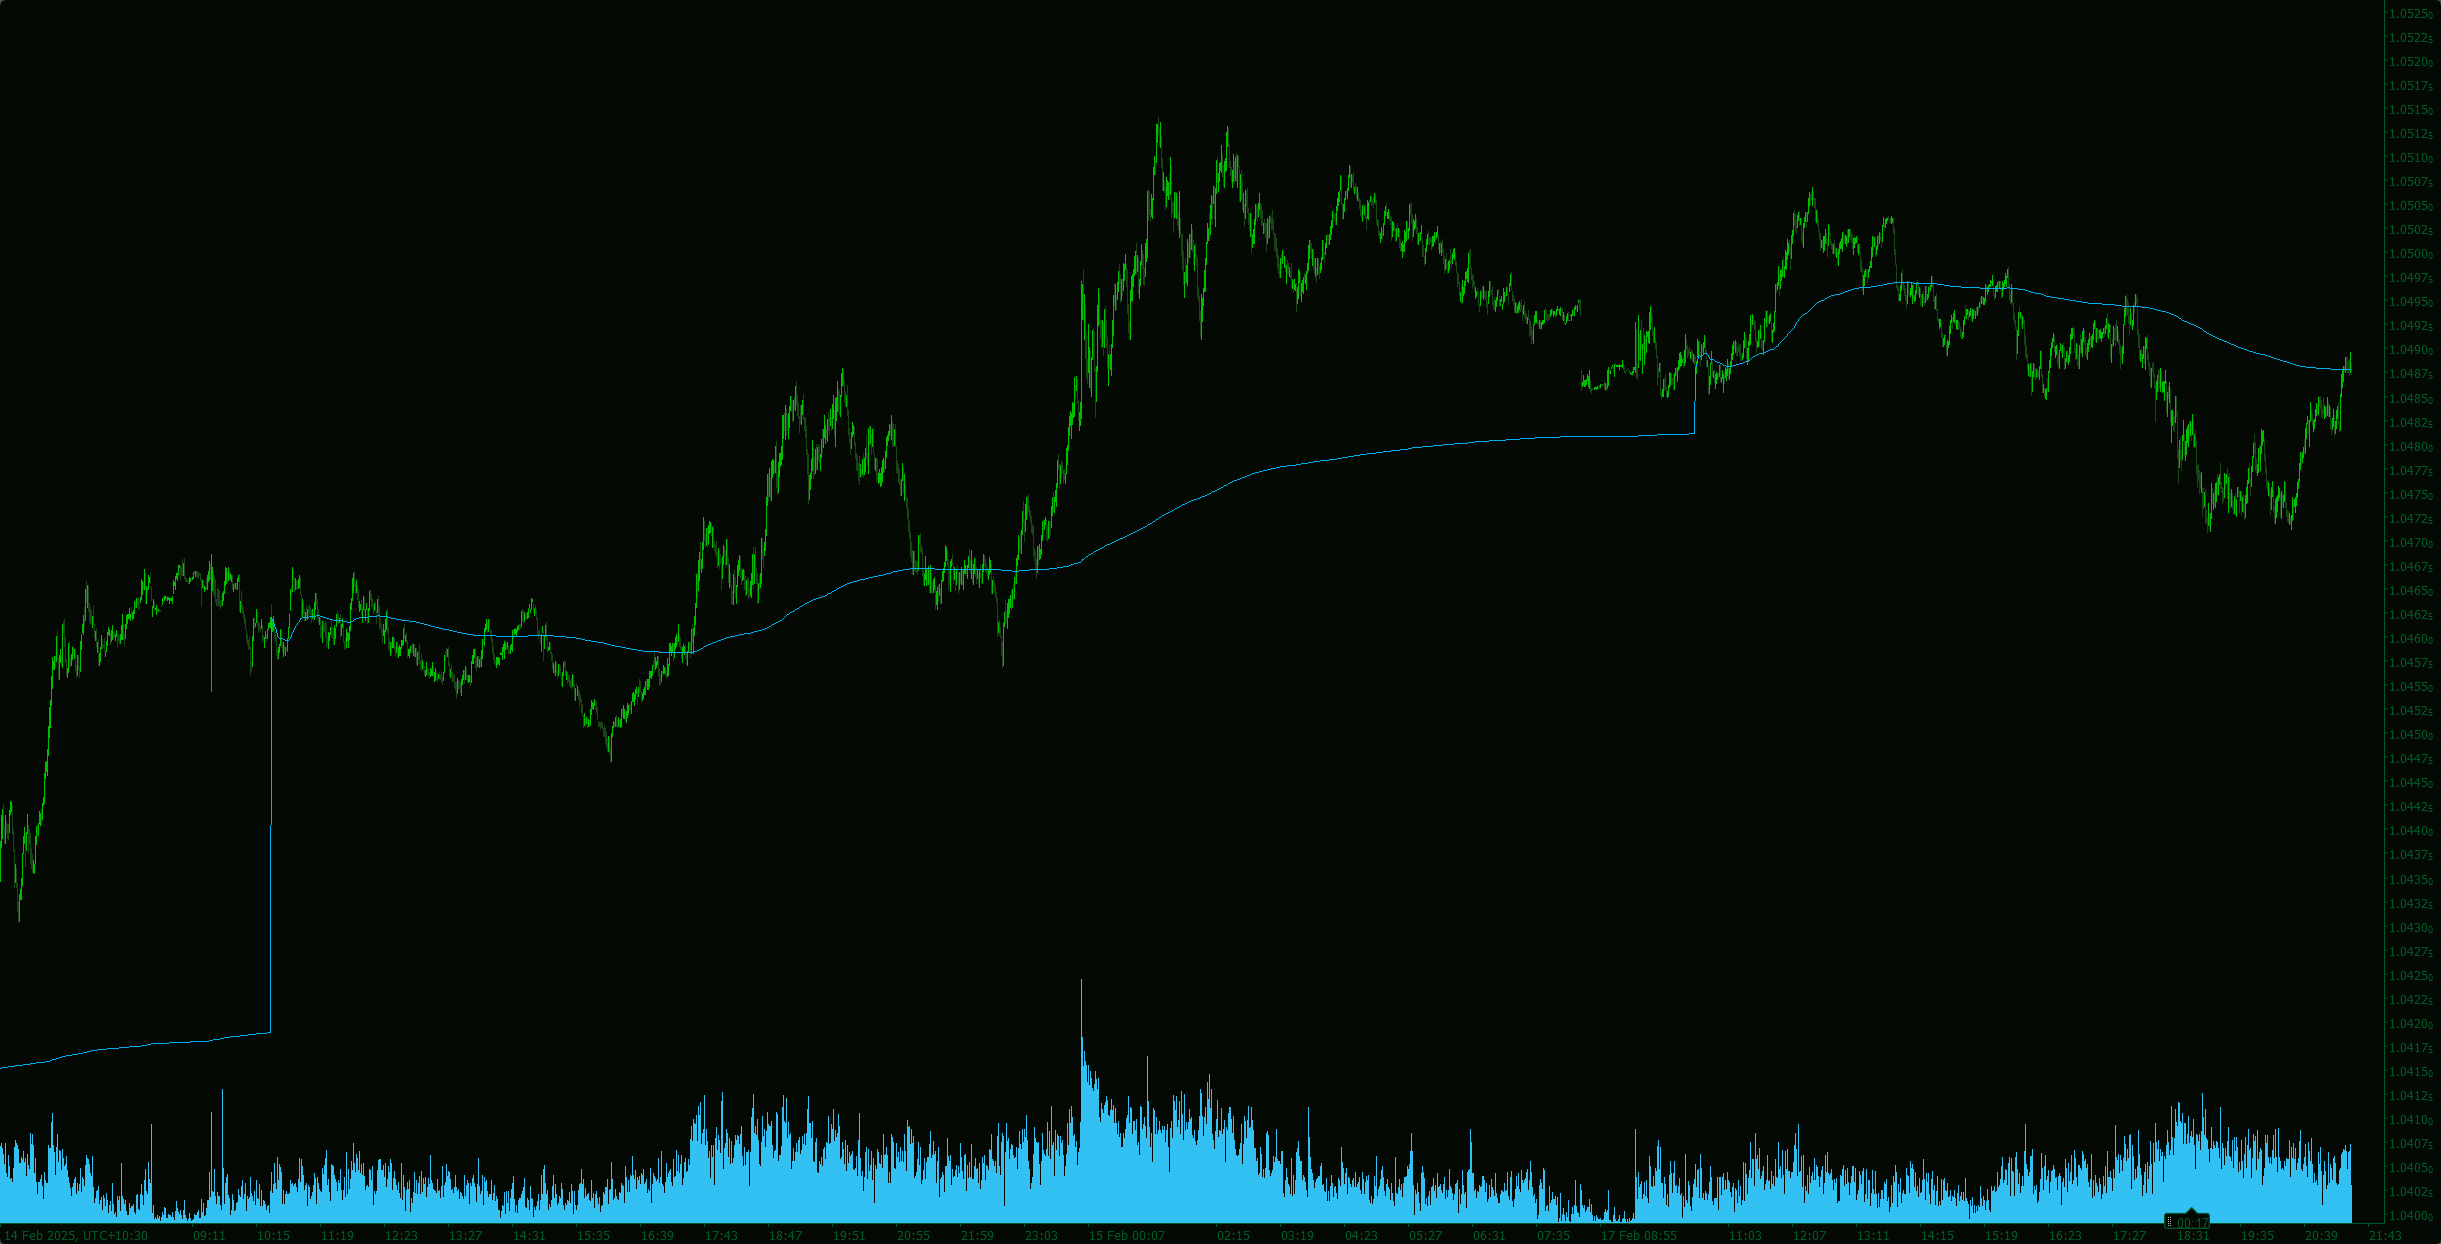
    Benefit from a suite of smoothing tools including an optional SMA and dual Hull Moving Averages (short and long term) that filter out noise and highlight true market trends, giving you the clarity to make confident trading decisions.
  • Customizable & Robust:
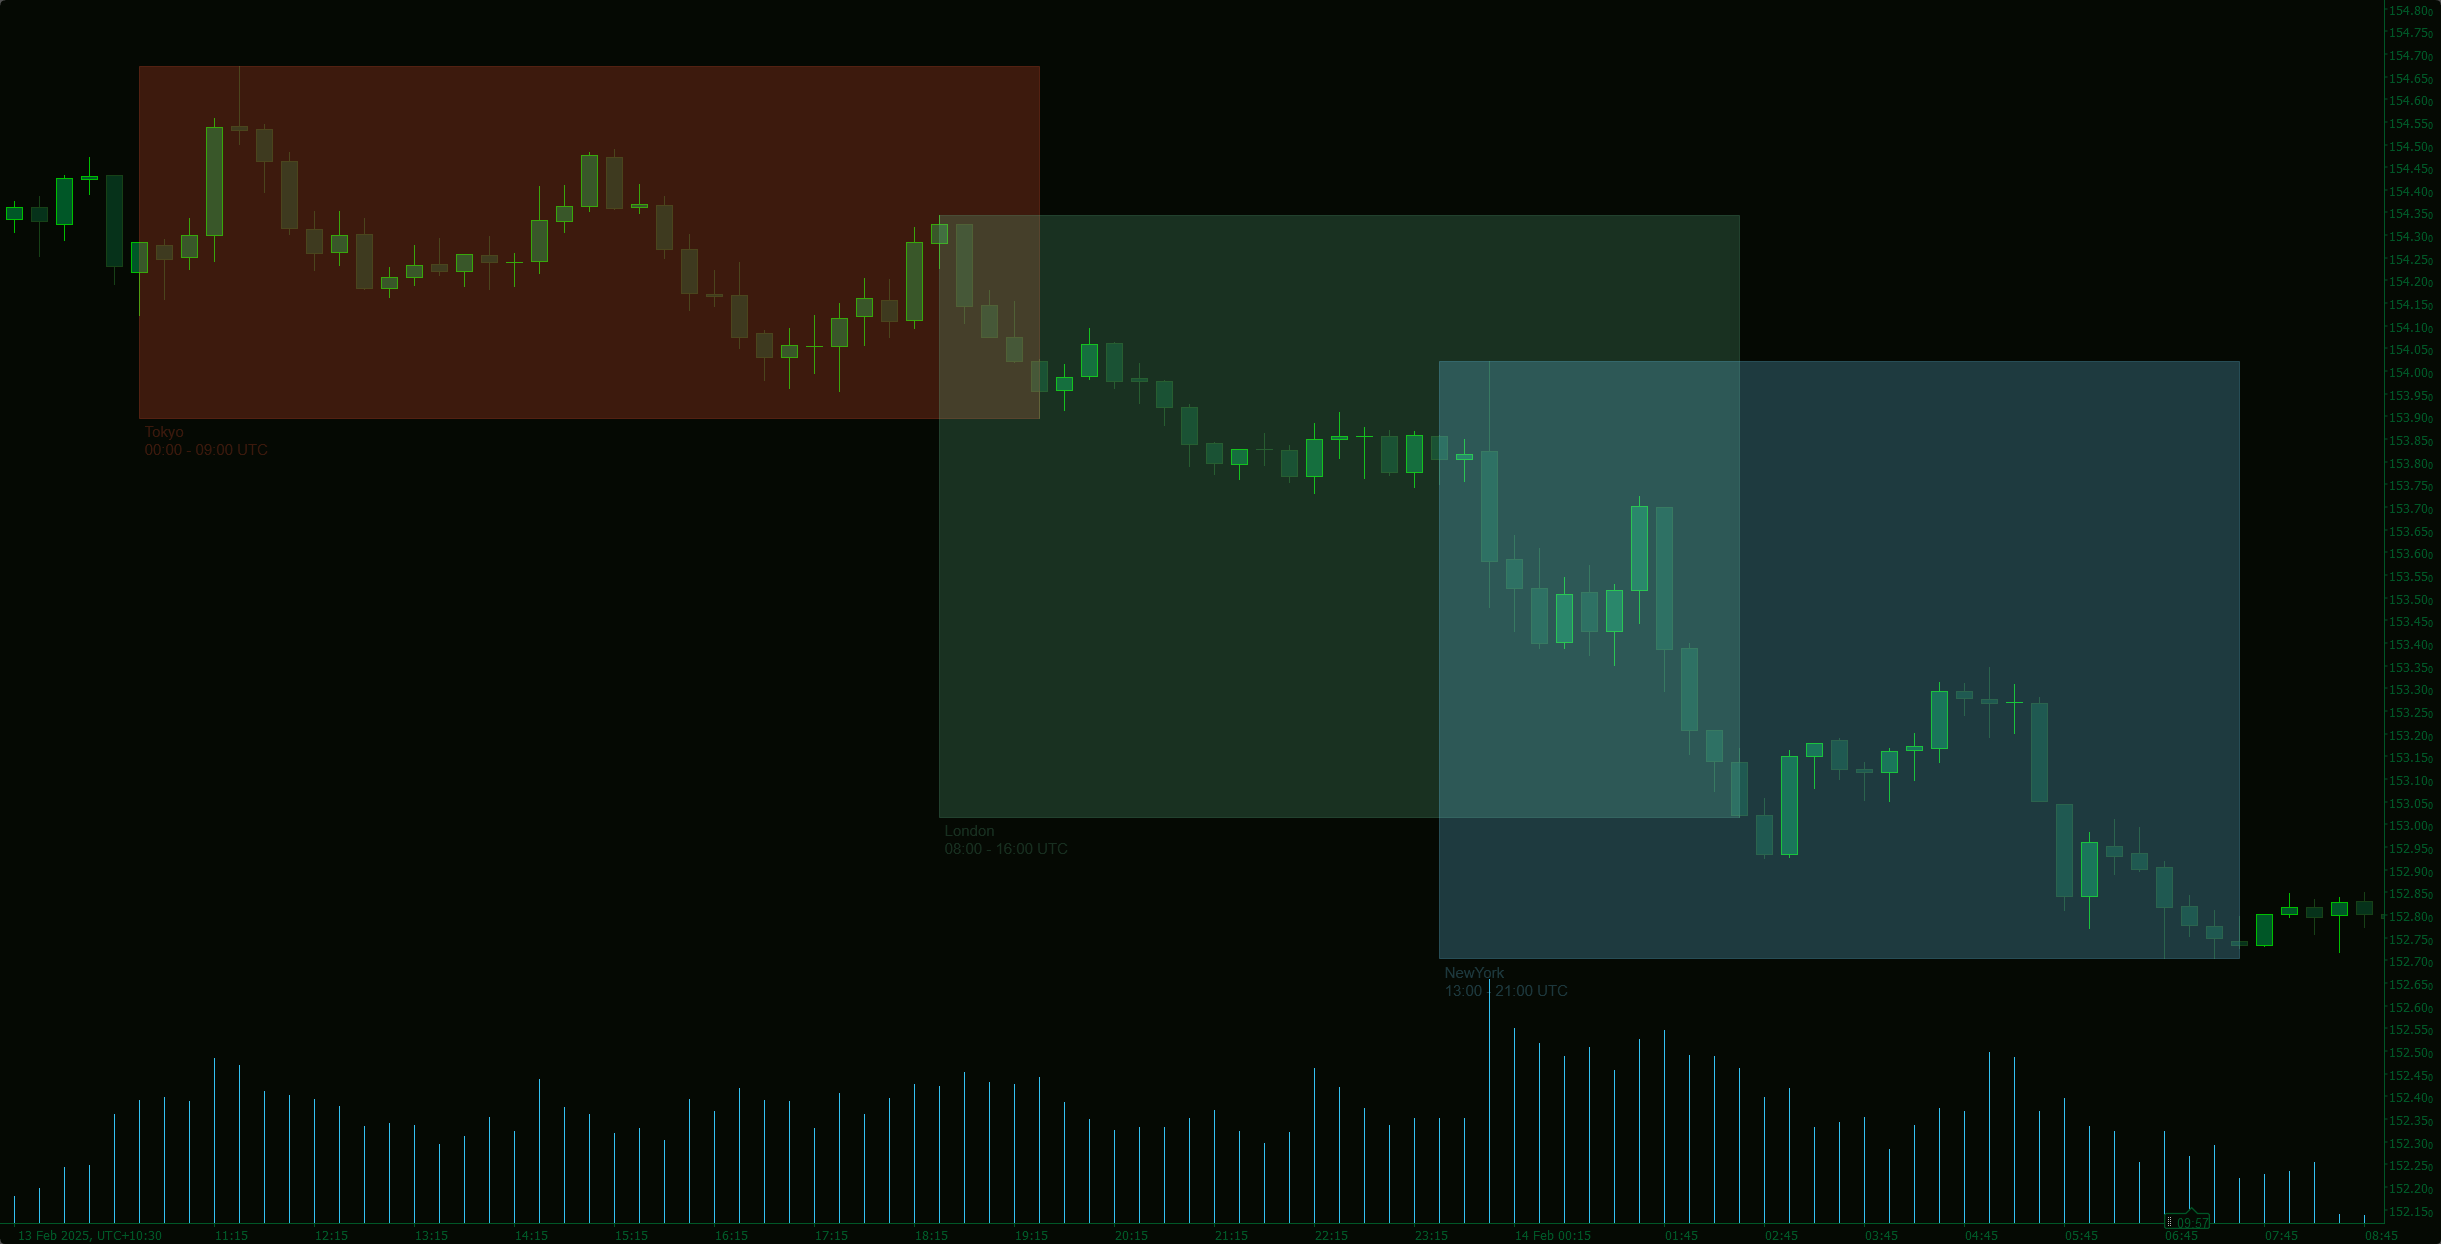
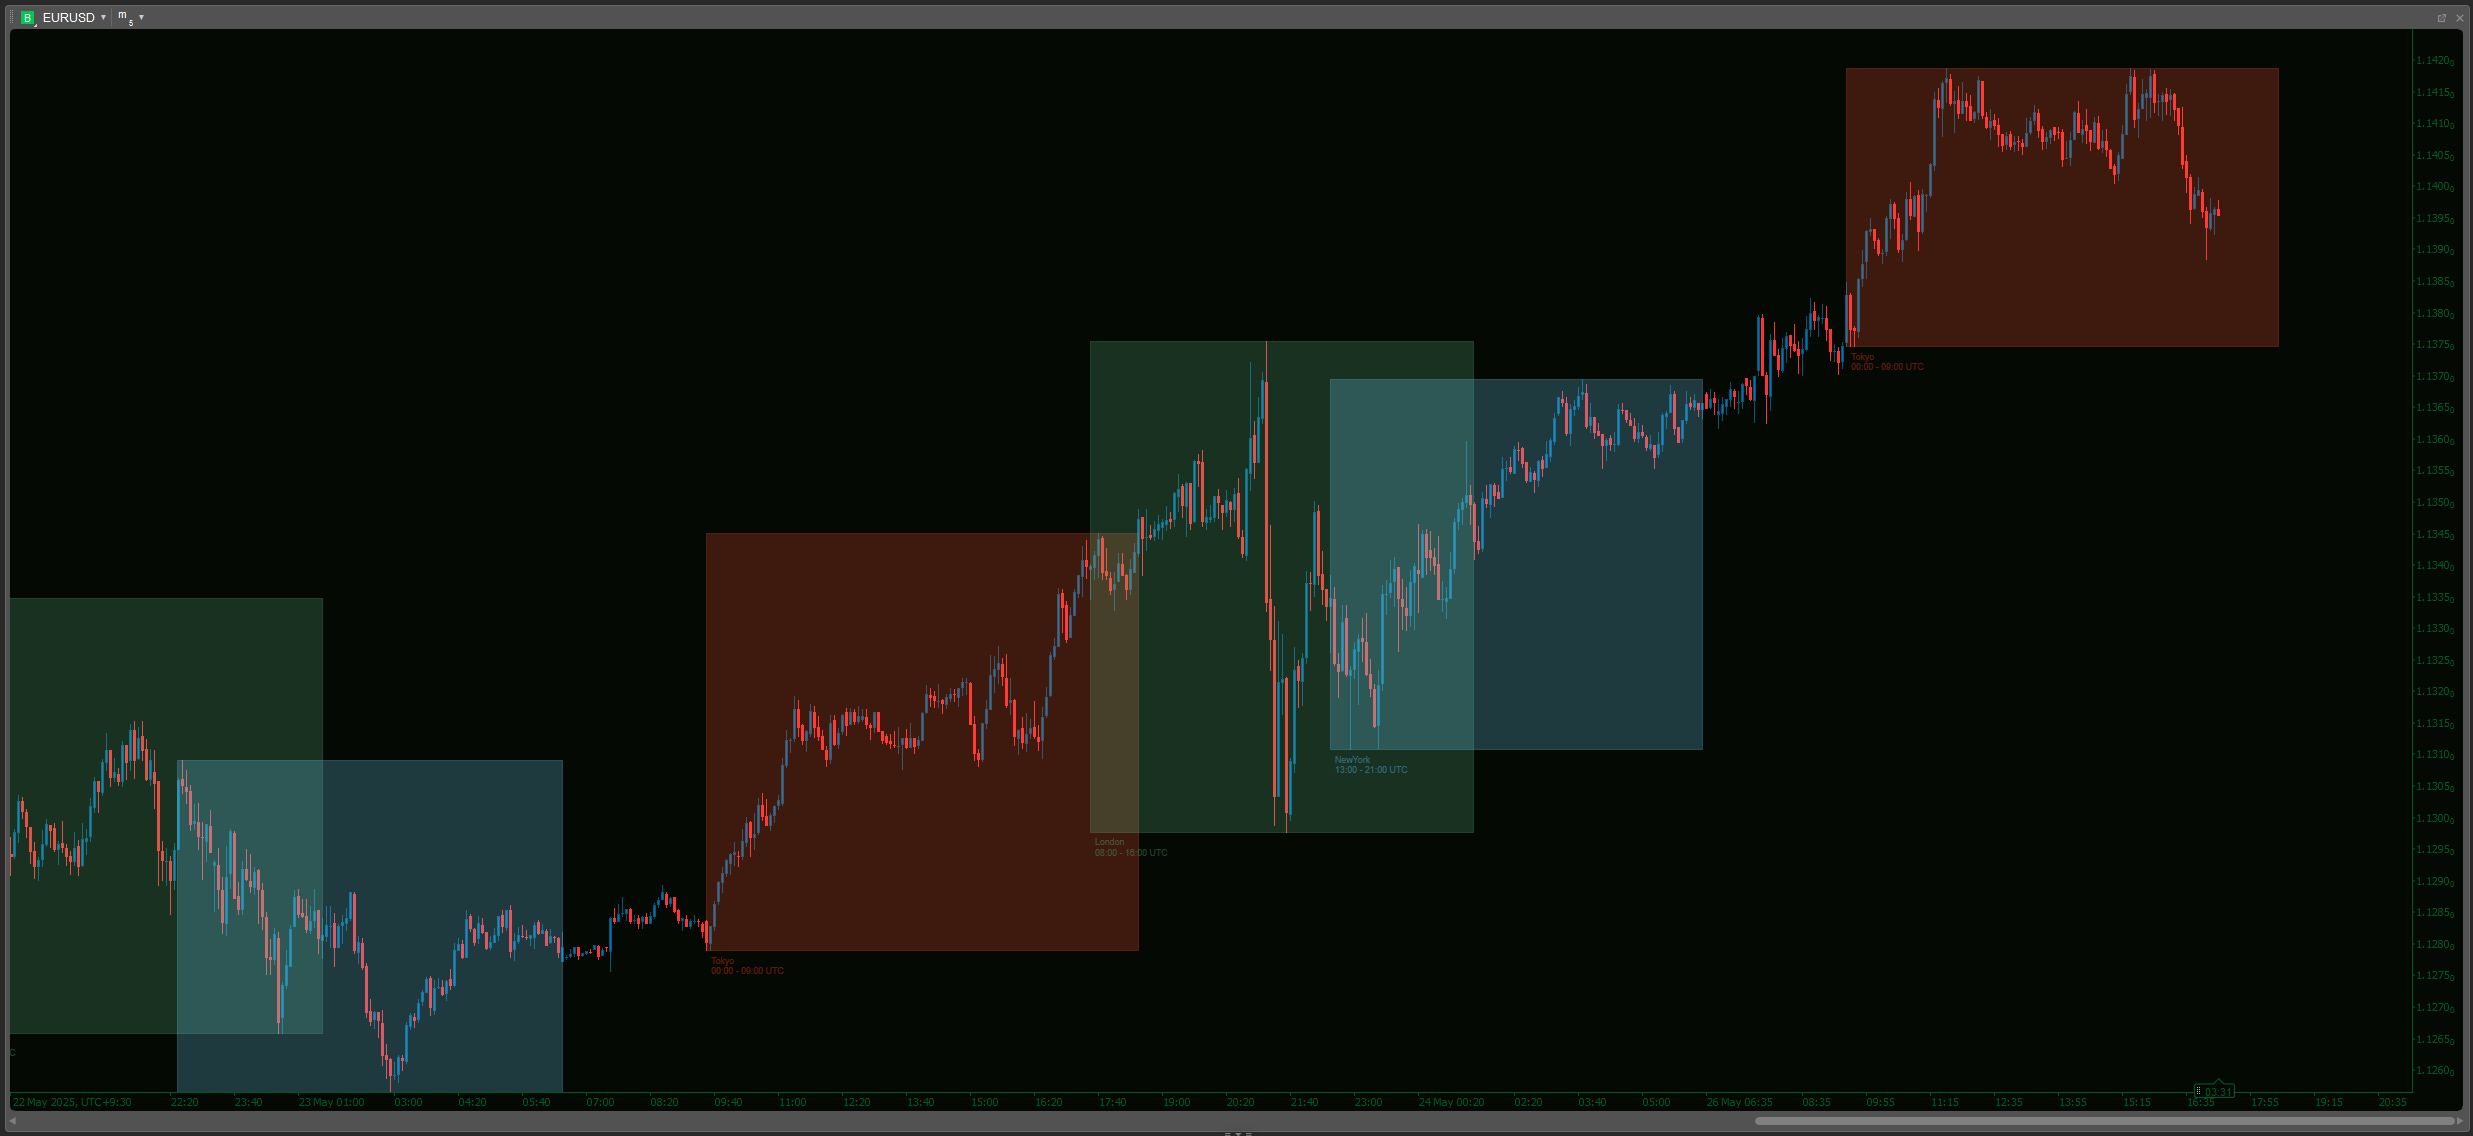
    Adjust parameters like the candle lookback count, weightings, and moving average periods to tailor the indicator to your unique trading style. Optional session resets keep your analysis fresh and aligned with the start of new trading sessions.
  • Actionable Insights:
    Whether you're tracking subtle shifts or major trends, the Historical JXY Indicator provides the actionable insights you need to capitalize on the momentum of the Yen.

Elevate your trading strategy with this cutting-edge technical tool. Harness the power of the Historical JXY Yen Index Indicator and turn complex market data into clear, strategic trading opportunities.


--------------------------

Please feel free to check out my other indicators!

https://ctrader.com/products/1181

https://ctrader.com/products/1182

https://ctrader.com/products/1180

https://ctrader.com/products/1015

https://ctrader.com/products/555

https://ctrader.com/products/553

https://ctrader.com/products/554

https://ctrader.com/products/552

https://ctrader.com/products/557

https://ctrader.com/products/845

https://ctrader.com/products/848

https://ctrader.com/products/847

https://ctrader.com/products/846

https://ctrader.com/products/551

https://ctrader.com/products/574

https://ctrader.com/products/573

https://ctrader.com/products/556

https://ctrader.com/products/558

https://ctrader.com/products/559

https://ctrader.com/products/560


0.0
Reviews: 0
Customer reviews
No reviews for this product yet. Already tried it? Be the first to tell others!
More from this author
Market Sessions - Free
Track major trading sessions (Tokyo, London, New York) with customizable colors and visual sessions on your chart.
Supply Demand V1-Premium
Auto-detect supply & demand zones, remove broken levels, and trade smarter with real-time alerts. Precision made simple.
Supply Demand - BasicV1
Supply and demand zones. They're important. Here's a free version to get you started!
MTF Candle Window - On Chart
The Multi-Timeframe Candle Indicator displays candles from multiple timeframes in one window, enhancing market analysis!
Market Sessions V2_NSC
Market Session V2: Full Control. colors, history, session/text toggles, font size. Elevate your strategy!
Volume Profile Triple Line - POC Median Mode
The Advanced Volume Profile Indicator calculates POC, Median, and Mode, revealing key price levels for smarter trading.
VWAP - London Open
VWAP Set to London Open
Market Session V3_NSC
Version 3: Full control of session display including start and end times of all 3 sessions!
VWAP Tokyo Open
VWAP Set to Tokyo Open
Supply Demand Premium V2_NSC
The long awaited new and improved Supply Demand Premium V2 indicator. Unlock greater trading opportunities now!
Indicator
Indices
Forex
EURUSD
+2
US Dollar Index
US Dollar Index
MTF Candle Countdown
Stay ahead with a real-time countdown to candle closes on all key timeframes: 5m, 15m, 30m, 1H, 4H, and Daily.
Open Trade PipsV1
This indicator tracks the unrealised amount of pips in your open positions.
Indicator
Signal
USDJPY
On Balance Volume USD - Combined
See USD demand in one line—Composite OBV fuses six major FX pairs into a clear momentum gauge.
Open Trade ProfitV1
A simple indicator that tracks the value of your open trades in pips.
Indicator
Indices
Commodities
CCI - With Arrows and 40 80 EMA Logic_noSourceCode
The Advanced CCI & EMA Indicator combines the CCI with 40 & 80 EMA logic to generate precise arrows signaling direction
Indicator
Indices
Forex
EURUSD
+1
DXY w HMA
DXY HMA Indicator
Commodity Channel Index Smoothed w Alerts_NSC
Smoothed CCI alerts! Audio & arrow signals for +/-100 crosses. Custom sounds & arrow filters. Precision trading!
You may also like
Indicator
RSI
Breakout
Signal
+1
ZScore
Z-Score measures price deviation from its average, helping identify extremes, trends, and trading opportunities ........
Indicator
Grid
Fibonacci
Simple Pivot Points
Clear pivot levels. Clean S/R zones. Five methods. Any timeframe.
Fair Value Gap
FVG Detector: Identify and label Fair Value Gaps, with age, status & multi-timeframe support.
Indicator
NAS100
XAUUSD
Breakout
+10
VWAPSigmaBandPRO_Max
Professional VWAP + Sigma Bands. Auto signals, 3 modes, live stats, multi-level entry/exit. Proven volume-based system.
Indicator
NAS100
RSI
NZDUSD
+13
Stochastic RSI PRO
Unlock Stochastic RSI PRO in cTrader! Overlay RSI, highlight zones, and identify divergences with customizable settings.
SmartBot-Tenkan & ATR Indicator
The Tenkan-ATR Indicator is a powerful and innovative indicator for Traders. SALE OFF!!!
ms_Candle_ColseTime
⏱ Candle Time Remaining – Real-Time Candle Countdown Indicator
Indicator
NAS100
NZDUSD
Martingale
+26
vWAP plus
An advanced VWAP with multi-VWAP (Daily/Weekly/Monthly/Anchored), click-to-anchor, configurable alerts, a stats panel,
Reversal Probability Engine
Detecting reversal zones + multidimensional mapping of support and resistance "Golden Levels.
Indicator
Forex
Signal
USDJPY
Yen Strength - Line Momentum
Single-line JPY Strength Indicator: Track yen momentum swiftly across key pairs—achieve clarity in your forex trades!
Advanced Market Structure Bos,Choch,SwinLevels, Order Blog
Advanced price action tool that combines multiple technical analysis concepts
Indicator
Breakout
Institutional Flow Radar
Institutional Flow Radar scans the chart for abnormal volume events and classifies them into two groups: Capital &Public
KDJ
The KDJ oscillator display consists of 3 lines (K, D and J - hence the name of the display) and 2 levels.
Indicator
Breakout
ATR
Signal
UT Bot
ATR-based trend following tool with trailing stop logic. Highlights crossovers using clean up/down bands and bar colour.
Drawing Utility
A rectangular box with 5 adjustable Fibonacci level or even custom ones.
Free
VWAP Pro
Advanced VWAP with up to 30 anchored levels, multiple timeframes, memory mode, standard deviation bands & simple GUI
VegaXLR - Fibonacci Bands
Customizable Dynamic Fibonacci Channels and Smart Alerts
Indicator
NAS100
NZDUSD
Breakout
+12
Multi_TF Candlestick Chart Overlay
Perfect for traders who demand a clear overview of multiple timeframes at a glance.