
Trendline and Trend Break Indicators for cTrader
Use trendline and trend break indicators for cTrader to monitor forex direction and possible shifts in momentum. These tools help traders track dynamic levels, confirm breakouts and manage entries around changing market structure.
Tools
Tool comparison
FAQ
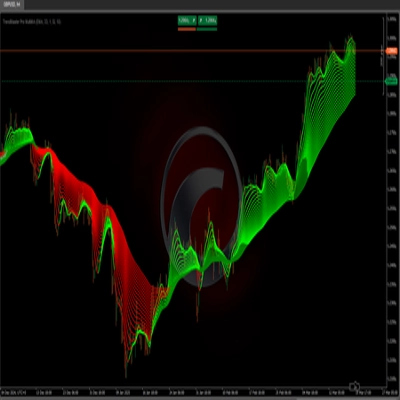
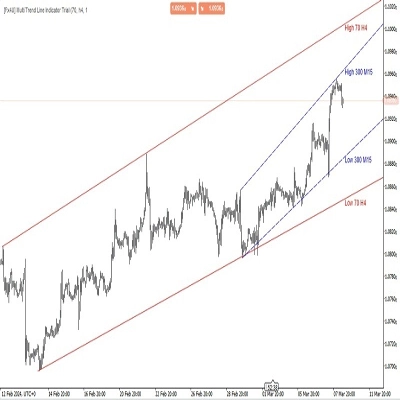

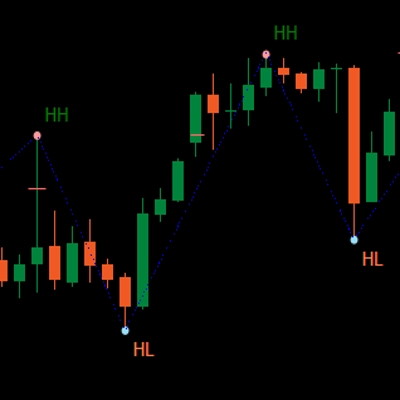
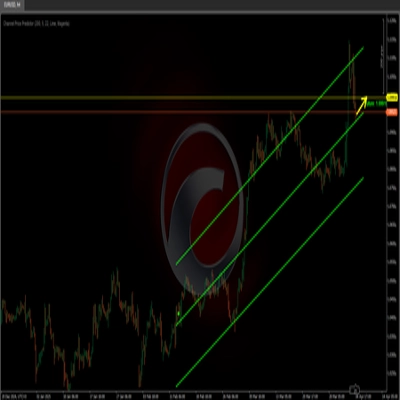
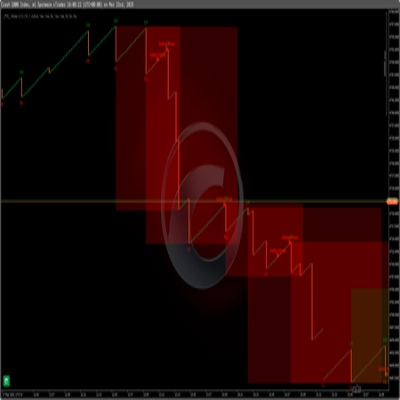


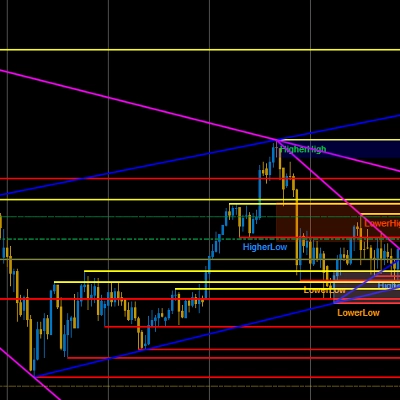
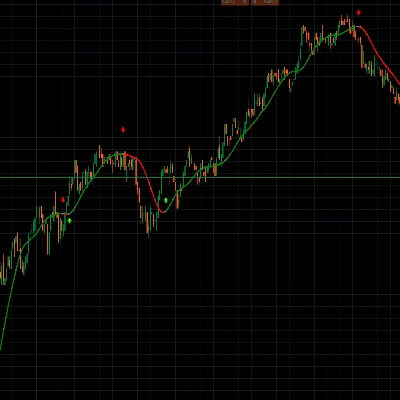

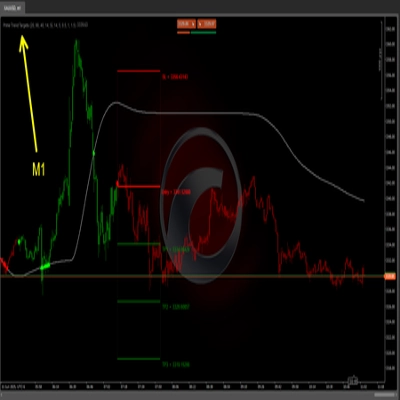
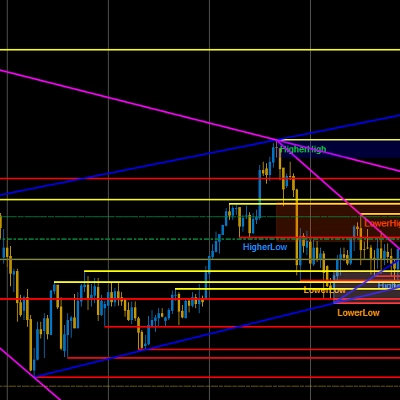
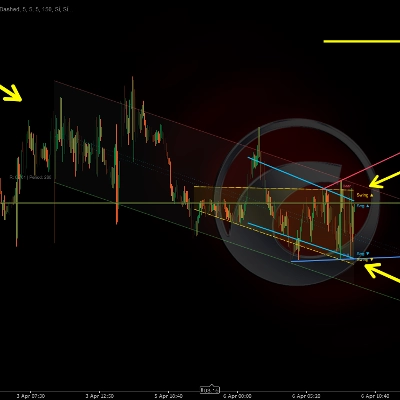





Tool comparison
Product | Reviews | Downloads | Sales | Price | Compatible platforms |
|---|---|---|---|---|---|
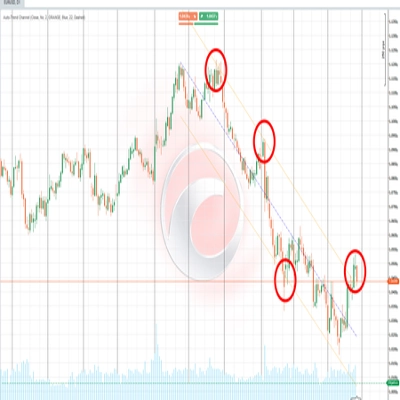
Auto-Trend Channel | 4.4 (5) | 3.08K | — | Free | Windows, Mac |
VegaXLR - Unlimited Trendline Alerts | 5.0 (3) | — | 34 | $20 | Windows, Mac |
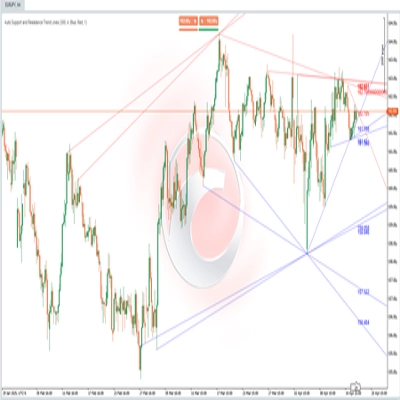
SmartTrend Support & Resistance Lines | — | 774 | — | Free | Windows, Mac |
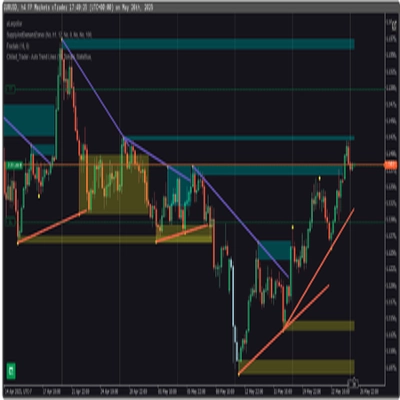
Trend Lines Auto - FXMaster | 4.3 (3) | — | 13 | $19 | Windows, Mac |
TrendMaster Pro MultiMA | 5.0 (1) | 750 | — | Free | Windows, Mac |
Fx4U.Multi Trend Line Indicator | 4.3 (3) | — | 11 | $25 | Windows, Mac |
[Stellar Strategies] Wave Trend Pro | 5.0 (1) | 506 | — | Free | Windows, Mac |
LT_SmartSwings | 5.0 (2) | — | 7 | $19 | Windows, Mac |
Channel Price Predictor | 5.0 (1) | 481 | — | Free | Windows, Mac |
Whale Hunting For boom crash | 4.3 (3) | — | 6 | $55 | Windows, Mac |
WeTrade Trendline Breakout | 5.0 (1) | 440 | — | Free | Windows, Mac |
Auto Tools Suite | 4.3 (3) | — | 6 | $19 | Windows, Mac |
SupportResistance | 5.0 (1) | 431 | — | Free | Windows, Mac |
Coloring Trendline with arrows | 4.0 (3) | — | 5 | $19 | Windows, Mac |
Smart Trend Scanner | — | 417 | — | Free | Windows, Mac |
FimatheViewer | 4.7 (3) | — | 4 | $19 | Windows, Mac |
Prime Trend Targets | 4.0 (1) | 381 | — | Free | Windows, Mac |
Market Structure Pro | 4.3 (3) | — | 3 | $65 | Windows, Mac |
Trend Lines Premium Engine | — | 296 | — | Free | Windows, Mac |
VegaXLR - Analysis Tools Alerts | 4.5 (2) | — | 2 | $20 | Windows, Mac |
Linear Regression Channel | 5.0 (1) | 242 | — | Free | Windows, Mac |
Advanced Donchian Zones | 4.4 (5) | — | — | $19 | Windows, Mac |
Fibonacci Pitchfan | — | 237 | — | Free | Windows, Mac |
Dynamic Trend Flux | 4.0 (3) | — | — | $19 | Windows, Mac |
Instantaneous Trendline | 5.0 (1) | 227 | — | Free | Windows, Mac |
pjsKalmanTrend | 4.5 (2) | — | — | $30 | Windows, Mac |
Dynamic Trendline Indicator-cBot | — | 219 | — | Free | Windows, Mac |
Nadaraya-Watson Kernel Regression | 5.0 (3) | 178 | — | Free | Windows, Mac |
Gann High Low Activator | — | 114 | — | Free | Windows, Mac |
FAQ
An automatic trendline indicator joins two confirmed pivot highs or lows, found with a set pivot length, and extends the line forward. Falling lines link lower highs and rising lines link higher lows, and a trend break is flagged when a candle closes through the line.
Many read it as a possible end of the downswing rather than a confirmed reversal, and some wait for a retest from above. Others want momentum to turn up as confirmation, since many breaks fail and price slips back under the line within a few bars.
Each new pivot can produce a line that fits better, so the indicator replaces the old one. A break seen in history may never have been visible live, and while a longer pivot length means fewer redraws, it also draws lines later.
Not exactly, because gold and crypto often spike through lines during news or thin hours, while stocks can gap past them at the open. Breaks on H4 or daily charts involve more data than M5 breaks, so many traders check the higher-timeframe line before acting on a lower-timeframe signal.
No, it only draws lines and may alert on a break, so any order is placed by you or by a cBot you run separately. On cTrader's Windows or Mac app, where custom indicators work, the line study tools also let you draw trendlines by hand to compare with automatic ones.