Beschreibung
🚀 Über 10.000 Trader nutzen bereits unsere TOP Indikatoren🏆
Entdecken Sie, warum Profis uns wählen – die leistungsstärksten Tools auf cTrader (Indikatoren, Algorithmen und cBots) warten auf Sie.
👉 Holen Sie sich hier alle unsere TOP-Systeme:
_______________________________________________
📌 Market Structure Indicators
· ✅ AdvancedMarket Structure: Bos, Choch, SwinLevels, Order Blocks, Market Structure& Liquidity Finder
· 🔄 Dynamic Market StructureAnalysis of Turning Points
· 🧱 Order Block
· ⚖️ Market Imbalance
· ⛓️ BOS & CHOCH
· 🧠 ICT Power of 3
_______________________________________________
🔚 Smart Exit Systems
_______________________________________________
📐 ZigZag Indicators
· 🔍 ZigZag Price LiquidityProjection
· ➖ ZigZag
_______________________________________________
🧱 Support & Resistance Indicators
· 🟩 SmartTrend Support &Resistance Lines
· 🧱 All Support and ResistanceLevels
_______________________________________________
📊 Trend & Channel Indicators
· 📊 Supertrend
_______________________________________________
💧 Volume & Liquidity Tools
_______________________________________________
⚡ Momentum & RSI Indicators
· 🔎 Multi-Level Candle Bias
Tracker
_______________________________________________
🔮 Prediction & Projection Tools
· 📐 Vorhersage basierend auf Linreg& ATR
· 📏 Fibonacci Lineare RegressionMulti-Zeitrahmen
· 📈 Volume-Powered Market Flow Projector
________________________________________________________________________________________________________
________________________________________________________________________________________________________
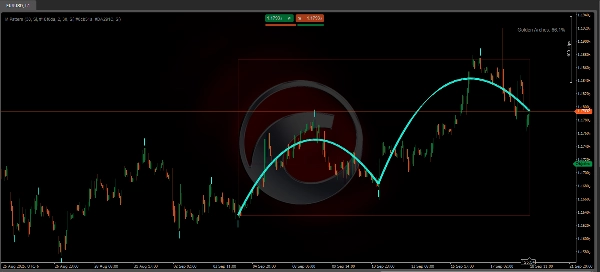
McDonalds Pattern Bézier Curve 🍟
Wofür ist es? 🤔
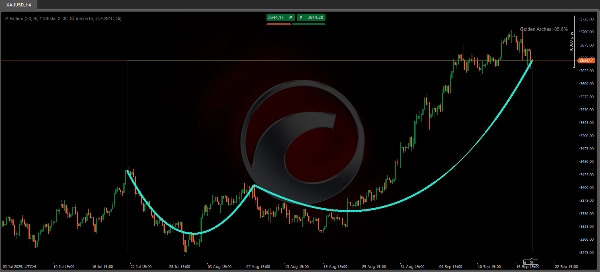
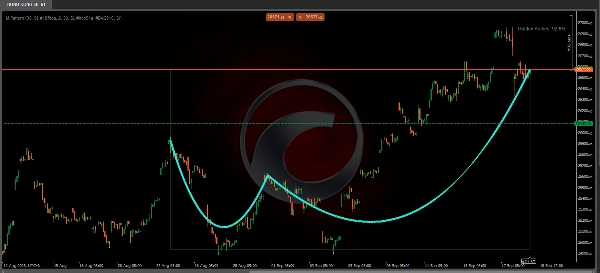
Der "McDonalds Pattern Bézier Curve" Indikator ist dazu entwickelt, Preisumkehrmuster zu identifizieren und zu visualisieren mittels Bézier-Kurven. Sein Hauptziel ist es, Marktstrukturen zu erkennen, die Bögen ähneln (ähnlich einem "M" oder "W") auf den Charts, was auf potenzielle Trendwechsel 🎯 hinweisen könnte. Zusätzlich beinhaltet er ein Punktesystem zur Bewertung der Qualität des erkannten Musters.
Wie funktioniert es? ⚙️
- Pivot-Erkennung:
Der Indikator analysiert einen Rückblickzeitraum (definiert durch "Lookback Period"), um lokale Hoch- und Tiefpunkte (Pivots) zu identifizieren. Diese werden mit Kreisen im Chart markiert: ⚪ - Bézier-Kurven:
Sobald mindestens 5 Pivots erkannt sind, zeichnet der Indikator zwei Bögen mit Bézier-Kurven, die diese Punkte verbinden. Diese Bögen sollen den Übergang zwischen den Pivots glätten, um eine visuelle Struktur ähnlich Zwillingsbögen ("Goldene Bögen") 🏛️ zu formen. - Farbige Zone:
Wenn aktiviert, wird ein Bereich zwischen dem ersten und letzten Pivot gezeichnet. Die Farbe dieser Zone hängt von der Richtung des Musters ab: -
- 🟢 Grün: Aufwärtstrend (wenn der letzte Pivot höher liegt).
- 🔴 Rot: Abwärtstrend (wenn der letzte Pivot niedriger liegt).
- Musterbewertung:
Es wird ein Prozentsatz berechnet, der die Symmetrie und Qualität der Bögen widerspiegelt. Eine höhere Bewertung deutet auf ein besser definiertes Muster hin.
Repaintet der Indikator? 🔄
Ja, dieser Indikator repaintet. Das bedeutet, dass seine Zeichnungen und Erkennungen sich rückwirkend ändern können, wenn neue Preisdaten eingehen. Dies liegt daran, dass die Identifikation dieser Wendepunkte auf der Beobachtung einer bestimmten Anzahl von Bars nach der Bildung des potenziellen Pivots basiert. Daher kann ein scheinbar bestätigter Bogen in historischen Daten angepasst oder verschwinden, wenn er auf Live-Charts 📊 angewendet wird.
Er kann als ergänzende Hilfe in der technischen Analyse verwendet werden.
Wie kann er verwendet werden? 💡
- 📚 Backtesting-Analyse:
Nützlich zum Studium historischer Muster und zur Bewertung ihrer Wirksamkeit auf verschiedenen Assets oder Zeitrahmen. - 👁️ Visuelle Bestätigung:
Kann andere Analysetools (wie Support/Resistance oder gleitende Durchschnitte) ergänzen, um potenzielle Umkehrungen zu validieren. - 🎓 Ausbildung:
Hilft beim Erkennen von Marktstrukturen basierend auf Bézier-Kurven, obwohl die Nutzung im Live-Trading eine zusätzliche Verifikation erfordert.
Einschränkungen und Empfehlungen ⚠️
- Echtzeitanwendung:
Da er repaintet, sollte er nicht als unabhängiges Signal für Marktein- oder -ausstiege verwendet werden. - Optimierung:
Passen Sie die "Lookback Period" entsprechend dem Asset und Zeitrahmen an, um Fehlsignale zu reduzieren. - Marktkontext:
Funktioniert am besten in Trendmärkten und nicht in Seitwärts-/Range-Märkten.
Wichtiger Hinweis: 🚨
Da er zur Bestätigung auf zukünftige Daten angewiesen ist, sollte er hauptsächlich zur Analyse von bereits eingetretenen Ereignissen verwendet werden, wie z. B. Kursrückgänge nach Markteröffnung oder zu Ausbildungszwecken in Chart-Übungen, und nicht für prognostische oder Live-Trading-Zwecke. Obwohl der Ansatz innovativ ist, muss er zusammen mit anderen Indikatoren und Analysen verwendet werden, um Fehlsignale aufgrund seiner Repainting-Eigenschaft zu vermeiden. Er eignet sich ideal für Backtesting-Studien oder als pädagogische Ergänzung in Handelsstrategien.
Zusammenfassung
This tool repaints, meaning its visualizations and detections can change retroactively as new price data arrives, so it is best used for backtesting, educational purposes, or as a complementary aid alongside other technical analysis tools. It is optimized for trending markets and requires adjustment of the lookback period to suit different assets and timeframes. The indicator supports markets including Forex (e.g., EURUSD), commodities (e.g., XAUUSD), and cryptocurrencies (e.g., BTCUSD).