Indicator
breakout
commodities
xauusd
rsi
"ZigzagSR" logo
ZigzagSR
0.0
01/08/2025
1
Desktop
"ZigzagSR" uploaded image"ZigzagSR" uploaded image"ZigzagSR" uploaded image

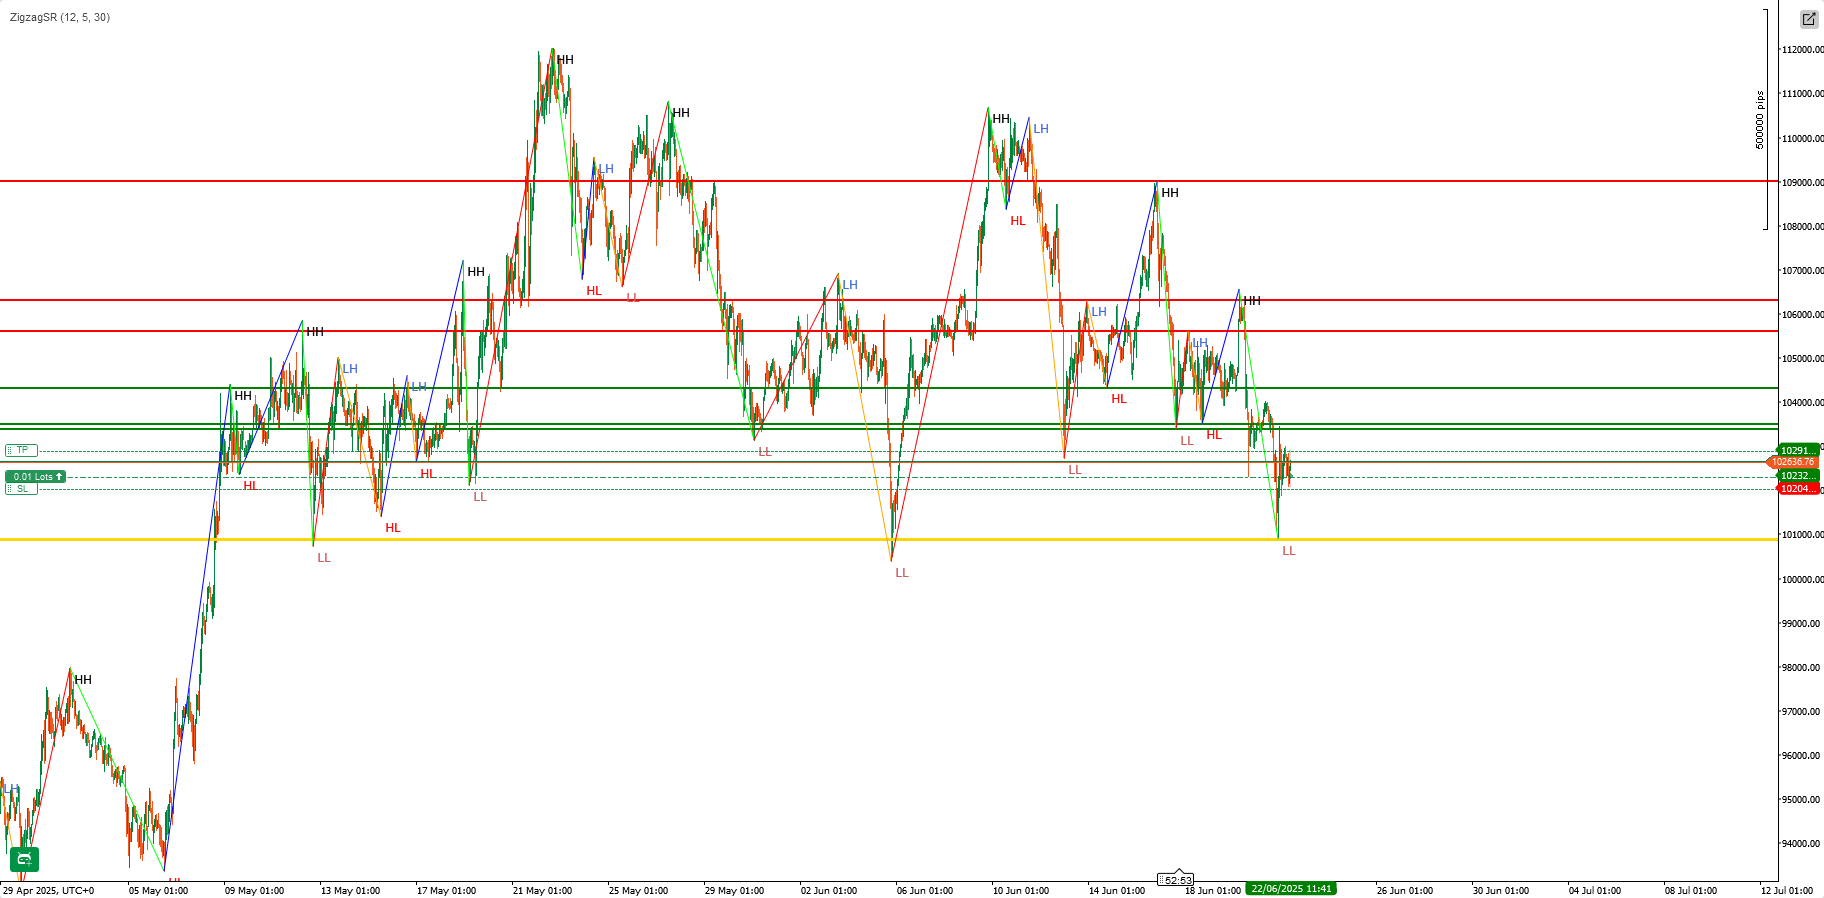
ZigzagSR – Dynamic Zigzag Swings with Automated Support & Resistance

Unlock clearer market structure and precise entry zones with ZigzagSR, a powerful cTrader indicator that:

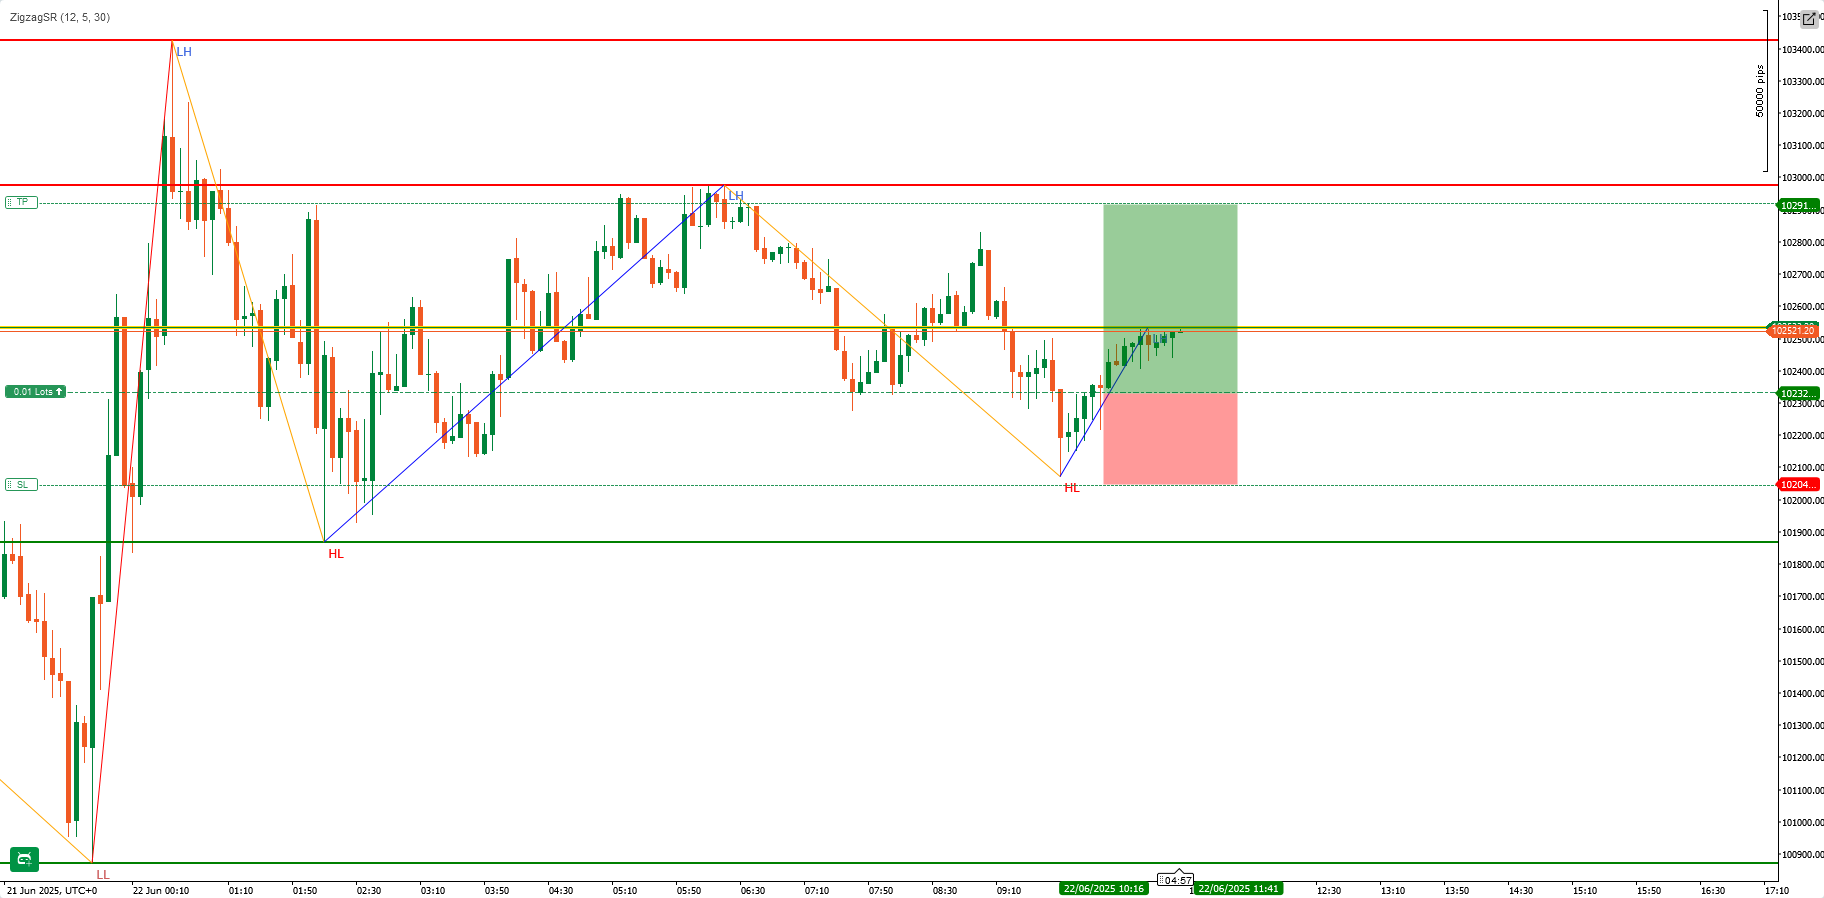
  • Plots non–repainting zigzag swings (higher highs, lower highs, higher lows, lower lows) in real time
  • Automatically draws dynamic support & resistance levels based on the most recent pivot swings
  • Labels each swing point (“HH”, “LH”, “HL”, “LL”) for at-a-glance trend clarity


Key Features

  • Adaptive Zigzag Detection
    • Configurable Depth, Deviation, and Backstep parameters to fine-tune sensitivity to market noise
    • Non-repainting logic ensures that historical signals remain stable once drawn
  • Automatic SR Levels
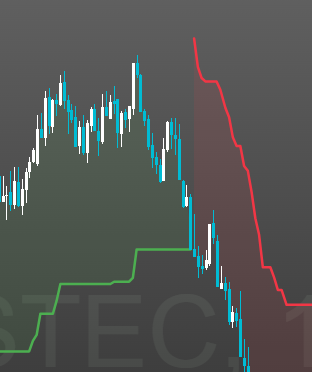
    • Draws a Pivot line at the last valid swing point (gold line)
    • Highlights up to the last three Resistance highs (red lines) and three Support lows (green lines) before the pivot
    • Lines update seamlessly as new swings form, keeping your chart tidy
  • Clear Visual Labels
    • “HH” (Higher High) and “LH” (Lower High) for bearish/higher peaks
    • “HL” (Higher Low) and “LL” (Lower Low) for bullish/lower troughs
    • Color–coded zigzag segments:
      • HH → Lime
      • LH → Orange
      • HL → Blue
      • LL → Red


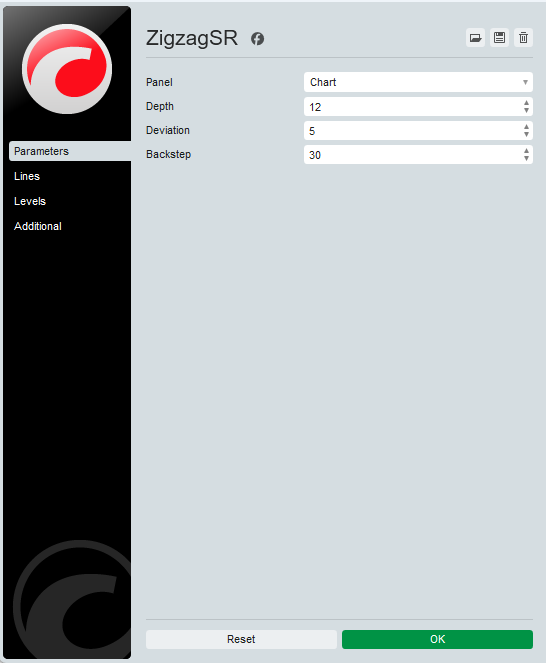
Inputs & Customization

ParameterDefaultDescription

Depth

12

Look-back bars to identify local highs/lows

Deviation

5

Minimum price move (in ticks) to count as a swing

Backstep

3

Bars to “rewind” for suppressing false pivots

Tip: Increase Depth & Deviation on higher timeframes to filter noise; lower them on M1/M5 for sensitivity.


Why Use ZigzagSR?

  1. Trend Confirmation: Clearly distinguish impulsive swings vs. corrective moves—ideal for swing and breakout traders.
  2. SR Entry Zones: Automatically marked levels help you pinpoint entry, stop-loss, and take-profit zones without drawing lines manually.
  3. Strategy Development: Labels and lines feed directly into EAs/cBots or manual systems—build consistent, rules-based setups.


How It Works

  1. High/Low Mapping
    • Scans bars over the last Depth periods to flag local extremes (_highMap & _lowMap).
  2. Swing Construction
    • Alternates between bullish and bearish states, adding only significant pivots to the swing list.
  3. Label Assignment
    • Compares each pivot with the previous to tag it as HH/LH or HL/LL.
  4. SR Drawing
    • Identifies the latest pivot as the “pivot line,” then plots the preceding three valid highs and lows as resistance/support.
  5. Zigzag Rendering
    • Connects all swing points with colored trendlines and overlays text labels slightly offset for clarity.


Use Cases & Tips

  • Swing Trading: Ride multi-bar impulses—enter on pullbacks to the pivot line, target the next SR level.
  • Breakout Confirmation: Wait for price to pierce a resistance line drawn by ZigzagSR, then confirm with volume or RSI.
  • Overlay with Other Indicators: Combine with moving averages, RSI divergences, or volume profiles to strengthen signals.


Get started in seconds:

  1. Install ZigzagSR from the cTrader Store.
  2. Drop it onto any chart—no external libraries required.
  3. Tweak the three input parameters to your preferred timeframe and strategy style.

Elevate your chart analysis with real-time swing structure and dynamic support & resistance—try ZigzagSR today!

More from this author
Indicator
forex
indices
rsi
+3
Advanced RSI Indicator
Advanced RSI Indicator with multi-MA smoothing, Bollinger Bands, divergence detection, and fill zones for cTrader.
Indicator
forex
commodities
scalping
+1
Support & Resistance Pro
The Support & Resistance Pro helps traders identify key support and resistance levels for informed trading decisions.
FibonacciStrategyCBot
FiboSmart cBot automates Fibonacci-based trading with trend, RSI, and MACD filters, plus built-in money management, trai
Indicator
rsi
macd
Multi-Timeframe Market Levels
Unlock market insights with our Multi-Timeframe Market Levels indicator, enhancing your trading strategies effortlessly
Indicator
forex
commodities
atr
+2
LevelMaster SR
LevelMaster S/R: Pinpoint key support & resistance zones with precision. Perfect for traders of all levels Trade smarter
Indicator
forex
indices
crypto
+4
MACD Pro Trader
🚀 MACD Pro Trader – Advanced MACD with buy/sell signals, custom MAs & color-coded histograms for smarter trading! 📈🔥
Indicator
breakout
indices
vwap
+4
ProVWAP
Advanced Anchored VWAP for cTrader: volatility bands, real‑time alerts & customizable session resets.
Indicator
signal
macd
TradingViewMACD
Enhance your trading strategy with our customizable TradingViewMACD indicator. Optimize and elevate your market analysis
Indicator
eurusd
rsi
macd
Supply&Demand
Precision Supply & Demand zones indicator—automatically plots key buy/sell areas on your chart for smarter entries.
Indicator
breakout
AutoLines™ Support & Resistance
FlexSR auto‑detects pivot highs/lows to plot dynamic support & resistance lines Features customizable styling and option
Indicator
forex
breakout
commodities
+1
Advanced Donchian Zones
MTF Donchian: Identify trend breakouts & key zones with precision. Perfect for swing & day traders seeking accuracy!
SmartFibonacci
SmartFibonacci — automatic Fibonacci retracements & extensions with swing detection, alerts and clean labels for cTrader
You may also like
Indicator
signal
Trend Bars Color
New Trend whit buy-sell signal
Market Sessions Advanced
Advanced Market Sessions with ICT killzones
Zig zag v.1 Demo
ZigZag Pro DEMO – Multi-Swing Indicator for cTrader DEMO VERSION – 24 hours free trial! This is a DEMO version of the Z
Indicator
forex
vwap
rsi
+2
Market Cipher B
Market Cipher B
Indicator
bollinger
indices
rsi
Clustering
Clustering tool for traders with visual insights into market patterns.
Indicator
forex
indices
gbpusd
+11
ADXVMA Aurora Trend Filter
⚡ ADXVMA Aurora Trend Filter combines ADX trend strength with an adaptive EMA blend ⚡
Order Flow
Volumen Delta", es una representación visual del flujo de órdenes basada en el volumen de transacciones.
HMA MTF 2.0
HMA MTF 2.0 (Multi-Timeframe )
Indicator
breakout
session indicator
📈 Trading Sessions Indicator — London, New York & Tokyo Visualize Key Market Sessions + High/Low Levels with Precision
Indicator
breakout
BreakOut_Probability_Expo
Break Out Probability Experimental indicator. Credits for this indicator goes to Zeiierman !!!
Dhruvin Wick Candelssss
RSI‑powered robot for high‑volatility scalping, no fuss.
LT_FairValueGap
Detects valid Fair Value Gaps from strong 3-bar patterns. Keep drawing unfilled gaps until price fills them.
Indicator
bollinger
E7 Indicators Free Overlays
Bollinger Band Cloud, Heiken Ashi, Trend Follower and Parabolic SAR.
Tabajara corrigido[fix]
corrigido todos os bugs e cores invertidas tabajara antigo deleetado
IR Ichimoku Macd
this indicaotr show distance between Tenkan to Kijun, Close to Kijun and Close to Tenkan 
Indicator
breakout
scalping
SSL Channel
SSL Channel — Trusted by price action traders to stay on the right side of the trend.
Indicator
breakout
VegaXLR - Fixed Range Volume Profile
Identify key support and resistance levels through detailed volume distribution analysis.