
Keltner Channels advanced
Indikator
Version 1.0, Apr 2026
Windows, Mac
4.5
Bewertungen: 2

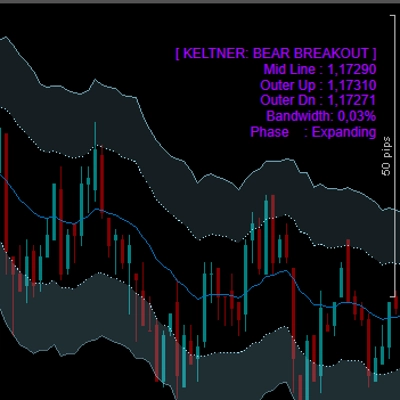
32
Verkäufe
992
Kostenlose Installationen
Beschreibung
Keltner Channels Advanced Cloud & Breakout System
Standard Keltner Channels sind ein fantastisches Werkzeug, um Volatilität und Trendrichtung zu erkennen, aber das Zeichnen einfacher Linien auf einem Chart ist nur der Anfang.
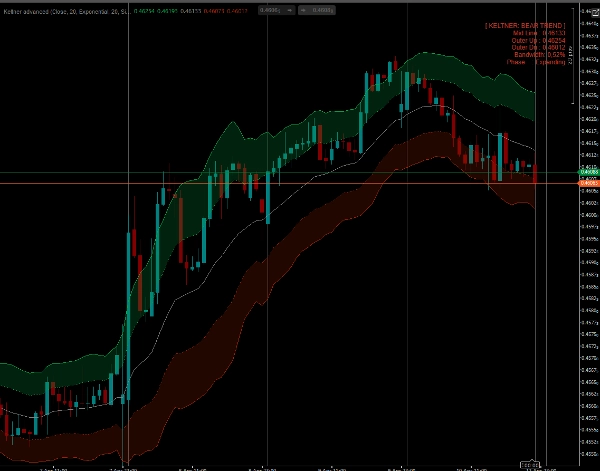
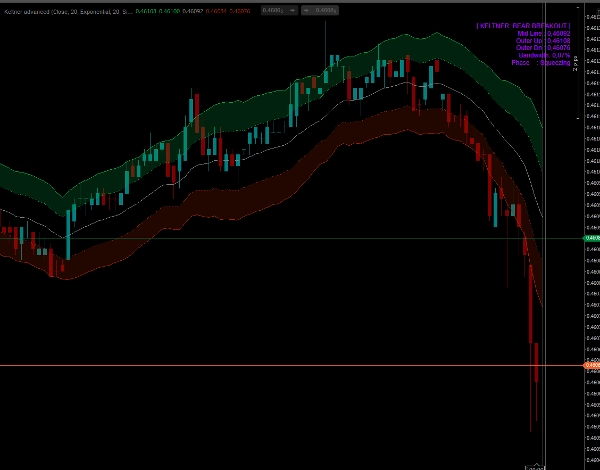
Das Keltner Advanced hebt diesen klassischen Indikator auf ein ganz neues Niveau. Durch die Einführung eines Dual-Band-Cloud-Systems, der Bandbreiten-Squeeze-Erkennung und Smart Paintbars verwandelt es einen einfachen Kanal in ein komplettes, visuelles Handelssystem für Ausbruchs- und Trendfolge-Trader.
Hauptmerkmale
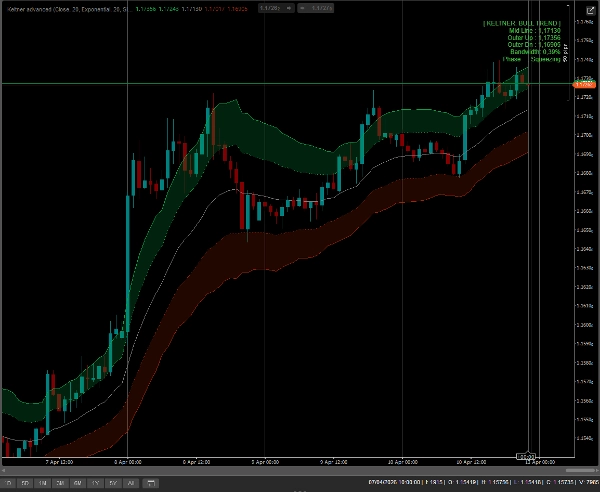
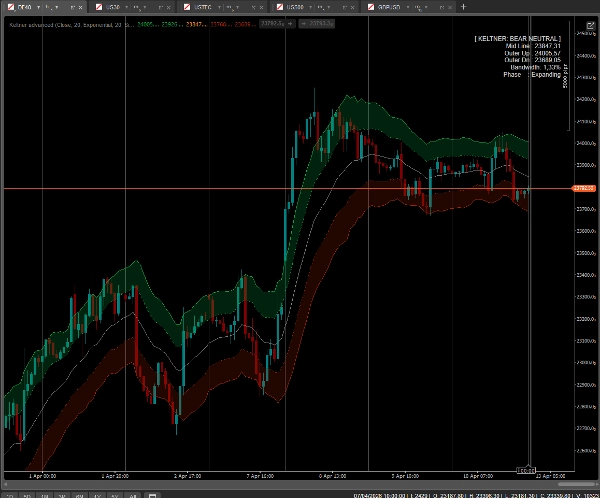
- Dual-Band-Cloud-System (Aktionszonen): Anstelle eines Kanals zeichnet dieser Indikator ein Inneres Band und ein Äußeres Band. Der Raum dazwischen wird mit einer dynamischen Wolke gefüllt.
-
- Preis innerhalb der Wolke? Sie befinden sich in einer starken, gesunden "Trendfahrt".
- Preis zwischen der Mittellinie und dem Inneren Band? Sie befinden sich in einer Rückzugs- / Mittelwertumkehrphase.
- Intelligente Balkenfärbung (Paintbars): Ihre Kerzen ändern ihre Farbe basierend auf ihrer genauen Position innerhalb der Kanalstruktur:
-
- Neongrün/Rot (Extrem): Preis bricht außerhalb des Äußeren Bands aus. Massive Dynamik oder Höhepunkt!
- Hellgrün/Rot (Trend): Preis bewegt sich innerhalb der Keltner-Wolke.
- Dunkelgrün/Rot (Rückzug): Preis zieht sich zur Mittellinie zurück.
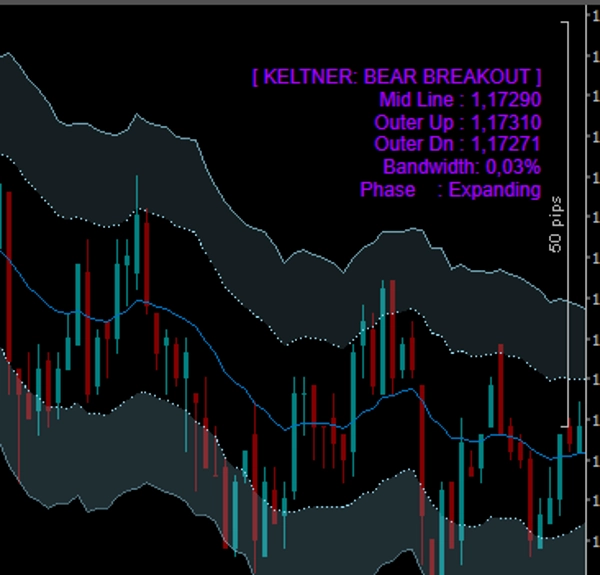
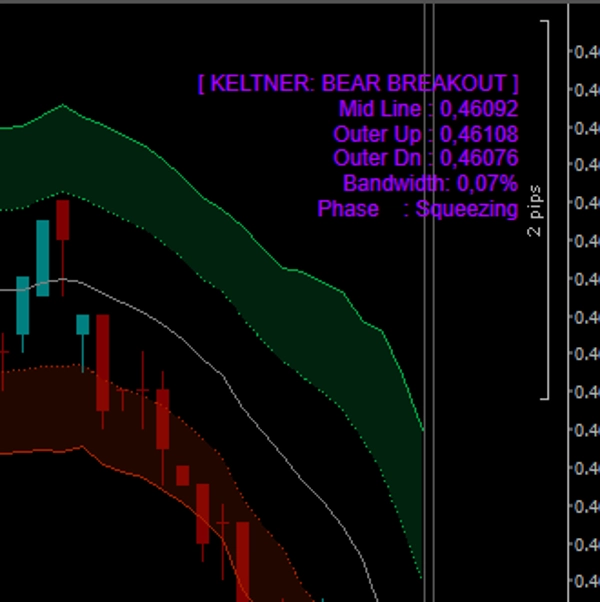
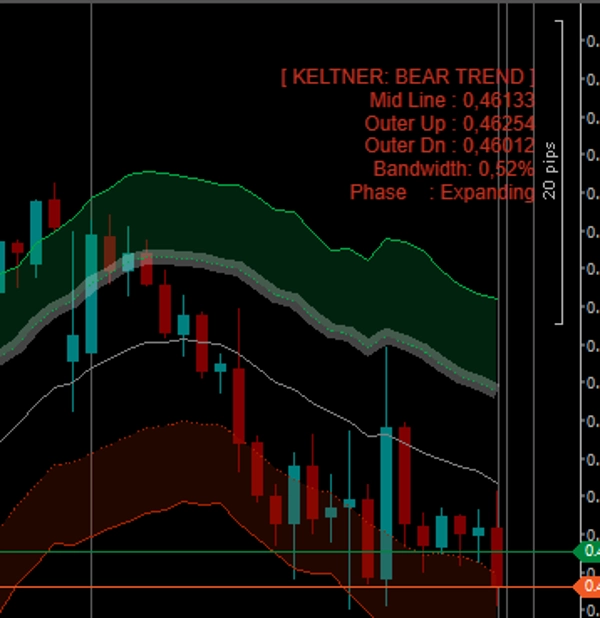
- Bandbreiten-Squeeze-Erkennung: Der Indikator berechnet ständig die Breite des Kanals und vergleicht sie mit vorherigen Balken. Das Dashboard zeigt Ihnen genau an, ob sich der Markt zusammenzieht (komprimiert für einen Ausbruch) oder ausdehnt.
- Echtzeit-Dashboard auf dem Chart: Ein schlankes, unaufdringliches Panel zeigt den aktuellen Marktstatus (Bullen-Trend, Bären-Ausbruch, Neutral usw.), genaue Band-Level, Bandbreiten-Prozentsatz und Volatilitätsphase an.
- Vollständig freigeschaltet: Handeln Sie mit JEDEM Symbol (Forex, Krypto, Indizes, Aktien) und JEDEM Zeitrahmen ohne Einschränkungen. Lebenslanger Zugang.
Wie handelt man damit?
- Der Ausbruch: Achten Sie auf dem Dashboard auf eine "Squeezing"-Phase. Wenn der Preis außerhalb des Äußeren Bands explodiert und die Kerzen Neon-Grün oder Rot färben, handeln Sie den Ausbruch mit starker Dynamik.
- Trendfolge: Sobald ein Trend etabliert ist, bleiben Sie in Ihrem Trade, solange die Kerzen hellgrün/rot gefärbt sind und "gleitend" innerhalb der Wolke liegen.
- Den Rücksetzer kaufen: Wenn der Preis zur orangefarbenen Mittellinie zurückzieht (Kerzen werden dunkelgrün), bietet dies oft einen risikoarmen Einstieg, um dem Haupttrend beizutreten.
Zusammenfassung
KI-Zusammenfassung
Keltner Channels Advanced is a volatility and trend analysis indicator that enhances the traditional Keltner Channels by incorporating a Dual-Band Cloud System, Bandwidth Squeeze Detection, and Smart Paintbars. It plots two bands—Inner and Outer—with a dynamic cloud between them to visually represent market action zones. Price positioning within these zones indicates trend strength, pullbacks, or extreme momentum.
Key features include:
- Dual-Band Cloud System: Differentiates between strong trend rides, pullbacks, and mean-reversion phases.
- Smart Bar Coloring: Candlesticks change color based on their location relative to the bands, signaling extremes, trends, or pullbacks.
- Bandwidth Squeeze Detection: Continuously measures channel width to identify market compression phases that often precede breakouts.
- Real-Time On-Chart Dashboard: Displays current market state, band levels, bandwidth percentage, and volatility phase.
- Compatibility: Usable on any symbol (Forex, Crypto, Indices, Stocks) and any timeframe without limitations.
Trading guidance suggests using the dashboard to identify squeeze phases for breakout trades, riding trends within the cloud, and entering on pullbacks to the mid-line for lower-risk entries. The indicator provides visual and signal-based tools to support breakout and trend-following strategies.
Key features include:
- Dual-Band Cloud System: Differentiates between strong trend rides, pullbacks, and mean-reversion phases.
- Smart Bar Coloring: Candlesticks change color based on their location relative to the bands, signaling extremes, trends, or pullbacks.
- Bandwidth Squeeze Detection: Continuously measures channel width to identify market compression phases that often precede breakouts.
- Real-Time On-Chart Dashboard: Displays current market state, band levels, bandwidth percentage, and volatility phase.
- Compatibility: Usable on any symbol (Forex, Crypto, Indices, Stocks) and any timeframe without limitations.
Trading guidance suggests using the dashboard to identify squeeze phases for breakout trades, riding trends within the cloud, and entering on pullbacks to the mid-line for lower-risk entries. The indicator provides visual and signal-based tools to support breakout and trend-following strategies.
Indikatorprofil
Indikatorkategorie
Volatilität
Ausgabetyp
Visualisierung
Signale
Filter
Datenanforderungen
Nur Balken
Unterstützte Signale
Trendstärke
Volatilität
Ausbruch
Diskussion
Kundenbewertungen
4.5
Bewertungen: 2
5 | 50 % | |
4 | 50 % | |
3 | 0 % | |
2 | 0 % | |
1 | 0 % |
Häufig gestellte Fragen (FAQ)
Key Levels
Channel
Über den cTrader Store verfügbare Produkte, einschließlich Handelsbots, Indikatoren und Plugins, werden von externen Entwicklern bereitgestellt und nur zu Informations- und technischen Zugriffszwecken verfügbar gemacht. cTrader Store ist kein Broker und erbringt keine Anlageberatung, persönlichen Empfehlungen oder eine Garantie für zukünftige Performance.






























Preis
32
Verkäufe
992
Kostenlose Installationen