"Trend Strength Signals St3llars33r" logo
Indicator
Version 1.0, Aug 2025
Windows, Mac
"Trend Strength Signals St3llars33r" uploaded image
Since 26/05/2025
355.65M
Traded volume
59.92K
Pips won
12
Sales
1.17K
Free installs

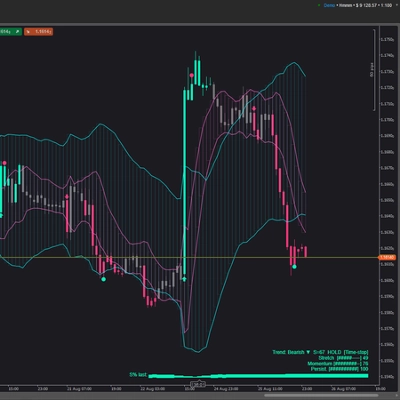
A visual toolkit for trend trading that blends a volatility envelope with a cycle-aware channel to show regime, timing, and risk at a glance. It’s designed to be readable on any background (light/dark) and to keep the screen clean while still giving you the “what to do next” hints.

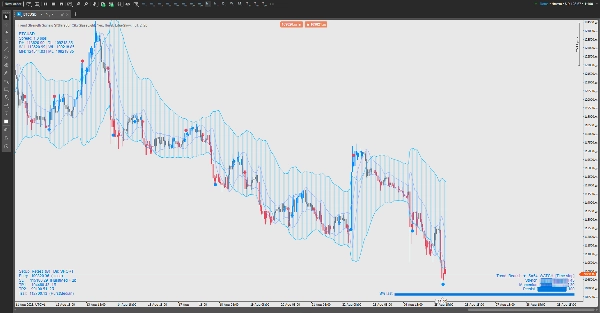
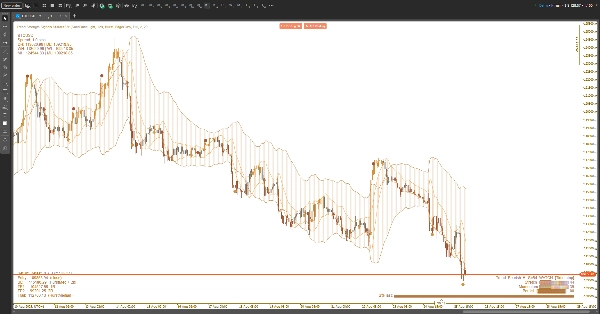
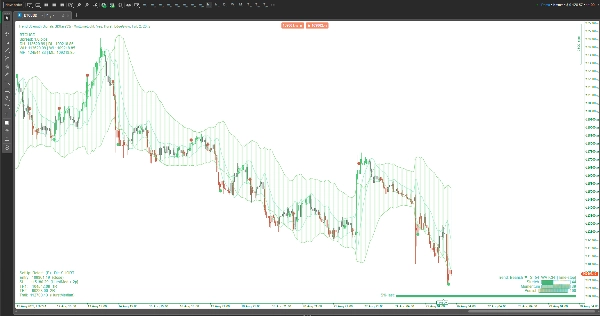
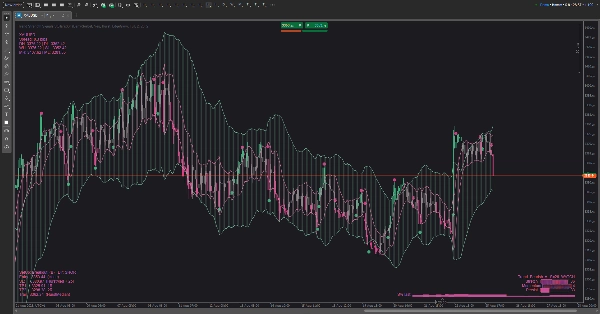
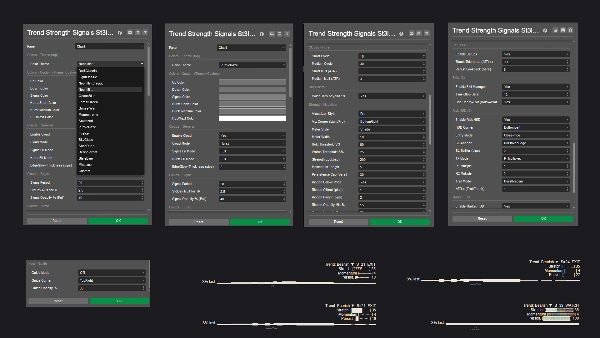
What you see on the chart

  • Clouds (toggleable):
    • A volatility cloud that expands/contracts with market activity.
    • A cycle cloud that tracks the rolling rhythm of price.
    • You can show either, both, or none.
  • Signals: unobtrusive up/down arrows for potential trend shifts; small dots for take-profit nudges.
  • Trend Strength HUD (three styles):
    • Light — a compact status tag.
    • Pro — a small dashboard with three meters (stretch, momentum, persistence) plus a mini history sparkline.
    • Ribbon — a soft bar near price whose intensity follows trend strength.
  • Risk HUD: proposes a direction, a protective stop area, two layered profit targets, and an optional trailing idea. It sits in any corner you choose and updates as the bar evolves.
  • Market HUD: symbol & spread, plus day/week/month high–low references, so you always know where you are inside the bigger map.
  • Themes: curated color sets for light and dark charts (and a Custom mode). All graphic elements—including HUDs and signals—follow the active theme.

How to use it (practical, not technical)

  1. Pick your cloud view:
    • Use the volatility cloud to see squeezes and expansions.
    • Use the cycle cloud to judge “edge” vs “middle” rotations.
    • Use both if you want context + timing.
  2. Read the Trend Strength:
    • When the status escalates to HOLD, bias trades with the current direction; when it drops to WATCH, reduce aggression; if it shows EXIT, avoid fresh trades or tighten risk.
    • In Pro mode, rising meters + rising sparkline = improving quality; fading meters = manage down risk.
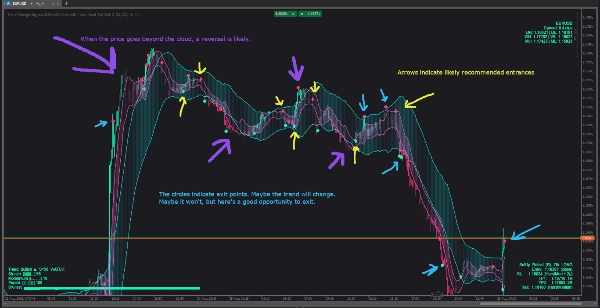
  3. Time entries with price vs cloud:
    • Breakouts after compression, re-entries after a polite pullback to the cloud, or bounces off an outer edge are the staple patterns.
    • If an early arrow appears mid-bar and then disappears, wait for bar close confirmation if you prefer fewer head-fakes.
  4. Manage the trade with the Risk HUD:
    • Place the protective stop roughly beyond the nearest structural boundary the HUD highlights.
    • Scale out at TP1, let the rest aim for TP2 or follow the suggested trailing line.
    • If Trend Strength decays from strong to weak, consider exiting earlier.
  5. Situational filters:
    • Avoid entries when clouds are thin and choppy, or when the strength status sits in EXIT.
    • Favor trades when strength is building, the cloud slopes, and price is interacting cleanly with edges.

Customization

  • Switch HUD corners, visualization style, and color theme to match your workspace.
  • Light-friendly themes keep text visible on white backgrounds; ocean/forest/sunset palettes add subtle contrast without glare.

What it’s not
This is not a black-box autotrader. It’s a decision aid: it frames trend quality, proposes sensible risk locations, and highlights high-probability moments—but you stay in control.

Indicator profile
0.0
Reviews: 0
Customer reviews
No reviews for this product yet. Already tried it? Be the first to tell others!
Products available through cTrader Store, including trading bots, indicators and plugins, are provided by third-party developers and made available for informational and technical access purposes only. cTrader Store is not a broker and does not provide investment advice, personal recommendations or any guarantee of future performance.

More from this author

Indicator
ATR
VWAP
+5
Candle Volume Profile for Crypto
Indicator
SMC
Prop
+14
Right-anchored cTrader Volume Profile with VAH/VAL/POC, LVZ, top volume+EMA, themes, and fast, readable visuals.
Indicator
Prop
Forex
+7
Heatmap of intra-HTF volume (POC/VA) built from LTF tick data; paints current candle and auto-loads visible history.
Indicator
Overlay HTF context on any chart: color bars by HTF and draw filled HTF bodies with optional High/Low lines.
Indicator
ATR
Prop
+13
Pro VSA tool with 3 modes: Fixed Ratios, Standard Deviation & Contextual VSA.
Indicator
ATR
SMC
+20
Session boxes, liquidity sweeps and higher‑timeframe levels for intraday trading
Indicator
10 configurable moving averages: choose type, period, color per line; single price source for all.
Indicator
Prop
Forex
+15
Tracks N-period highs/lows, HTF overlay, HUDs with ADX, RSI, session clocks. Customizable for precise trading.
Indicator
Market entropy + DC. Spot crystallization/chaos shifts with an optional on-chart overlay.
Indicator
Edge-aware clouds + Pro HUD: better entries, calmer exits, adaptive risk.
Indicator
SMC
Prop
+17
A multi-TF panel with candle timers, sessions, ticker, spread & 15+ themes. Fully customizable.

You may also like

Indicator
Support & Resistance
A full‑featured pivot point system with multi‑mode calculations, zone coloring, CPR levels, and left/right labels for pr
Indicator
TraderMax BB Filter X (DEMO) for cTrader 🧪 Limited-Time Demo Version (24h) TraderMax BB Filter X (DEMO) is a precision
Indicator
Breakout
Combines MACD momentum with Bollinger Bands volatility to identify explosive price breakout moments.
Indicator
Channel
Moving Average
+2
This is a high-quality implementation of the TTM Squeeze logic applied directly to candle coloring.
Indicator
Forex
Crypto
+2
Market Structure Indicator – Your Trading Map in a Noisy Market. No more Panicking Which one, Where, Why and How.
Indicator
Prop
VWAP
+15
VWAP: Follow the smart money. Trade with real volume and the fair price on your side!
Indicator
ATR
RSI
+14
Fear & Greed Index: 4 configurable components (momentum, volatility, strength, pattern) with 6 calculation methods each
Indicator
Volume
Key Levels
+2
Volume Profile Pro - A Highly Customizable and Lightweight Volume Profile
Indicator
Forex
EURUSD
+3
ALMA Smoothed Gaussian Moving Average (ASGMA) – by LudwigICT
Indicator
EURUSD
GBPUSD
+3
All-in-one suite for ICT concepts: NY Midnight Open, Killzones, automatic Liquidity levels (PDH/L, PWH/L).
Indicator
NAS100
Stocks
+1
Key NY session opens for NASDAQ (US100) & SP500 to find Tick Precise Entrys for High R:R intraday setups.
Indicator
AI
ATR
+27
Support and Resistance with signals
Indicator
XAUUSD
Professional Volume Profile Indicator - Shows volume distribution, POC, Value Areas & Buy/Sell pressure.
Indicator
VWAP
Moving Average
Vwap Bands it is highly sought after by professional traders because it includes Standard Deviation Bands
Indicator
Forex
BTCUSD
+4
The Linear Regression Oscillator (LRO) is a technical indicator based on linear regression analysis.
Indicator
AI
ATR
+23
The ZigZag Trend is a market structure tool that filters out small price fluctuations and highlights major swing.
Indicator
ATR
Support & Resistance
Price information (D/W/M range) + ATR + swap calculator with triple swap detection. Price GPS.
Indicator
AI
ATR
+27
Silver Bullet by LudwigICT
Since 26/05/2025
355.65M
Traded volume
59.92K
Pips won
12
Sales
1.17K
Free installs