说明
🚀 超过10,000名交易者已经使用我们的顶级指标🏆
发现为什么专业人士选择我们——最强大的工具在 cTrader(指标、算法和cBots)正等着你。
👉 在这里获取我们所有的顶级系统:
_______________________________________________
_______________________________________________
📌 市场结构指标
· ✅ AdvancedMarket Structure: Bos, Choch, SwinLevels, Order Blocks, Market Structure& Liquidity Finder
· 🔄 动态市场结构转折点分析
· 🧱 订单区块
· ⚖️ 市场失衡
· ⛓️ BOS & CHOCH
· 🧠 ICT 三力
· 🌀 市场极性区
______________________________________________________________-
商店cBots : 🧠 黄金 & BTC 突破会话枢轴 🧠
_______________________________________________
🔚 智能退出系统
· 📍 尾随智能算法
_______________________________________________
📐 之字形指标
· 🔍 之字形价格流动性投影
· 🧭 支撑阻力结构之字形
· ➖ 之字形
· 🎯 之字形极端追踪器
_______________________________________________
🧱 支撑与阻力指标
· 🟩 智能趋势支撑与阻力线
· 🧱 所有支撑和阻力水平
_______________________________________________
📊 趋势与通道指标
· 🔄 自动趋势通道
· 📊 超级趋势
· ⚡动量趋势分析器
· 🧠 自适应趋势通道
· 💥 通道突破系统
· 🌈 动态趋势梯度
· ⭐ 高级SSL通道
· 🔁 反应性移动平均线
_______________________________________________
💧 成交量与流动性工具
· 🔥 成交量POC热力图
· 📉 杠杆清算图
· 🔍 动量公平价值缺口
· 🕒 公平价值缺口会话
_______________________________________________
⚡ 动量与RSI指标
· 📈 RSI趋势触发器
· 🚀 动态范围动量
· 🔎 多级蜡烛偏差追踪器
_______________________________________________
🔮 预测与投影工具
· 📐 基于线性回归与ATR的预测
· 📏 斐波那契线性回归多时间框架
· 📈 成交量驱动的市场流动投影器
📉 斐波那契扇形
_________________________________________________________________________________
_________________________________________________________________________________
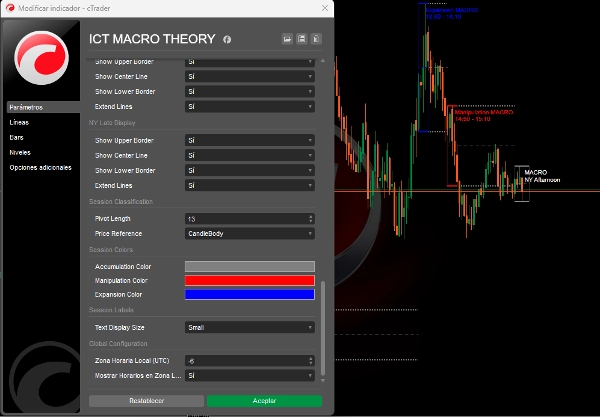
🌐 ICT 宏观理论
⚠️ 重要提示:此指标 仅适用于5分钟以下的时间框架。
ICT宏观周期解释
ICT宏观周期本质上是算法寻找流动性或调整价格以填补公平价值缺口的短时间间隔。这些ICT宏观的基础在于ICT的时间和价格理论。
宏观是 “一系列短指令,在价格传递中创建一个事件”,这是ICT本身的定义。
ICT宏观不是完整的交易策略,但它们可以为你的交易增加一致性并最大化利润。它们发生在伦敦、纽约、中午和下午交易时段。
🔮 ICT宏观时间理论的高级实现:
与ICT概念的直接连接:
代码精确实现了理论中描述的3种ICT宏观类型,使用基于以下内容的分类逻辑:
- 市场结构分析:
-
- 宏观会话检测
- 记录精确的ICT时间(伦敦02:33,纽约09:50等)。
- 检测每个宏观会话前后和期间的结构变化。
- 自动分类为:
-
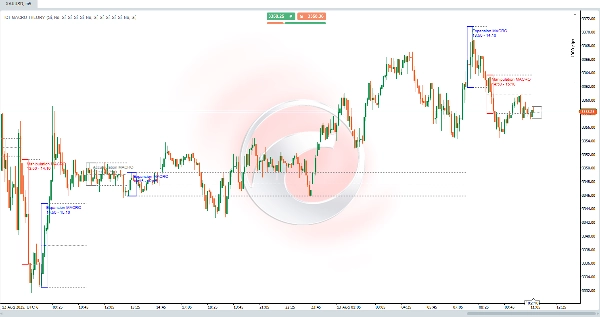
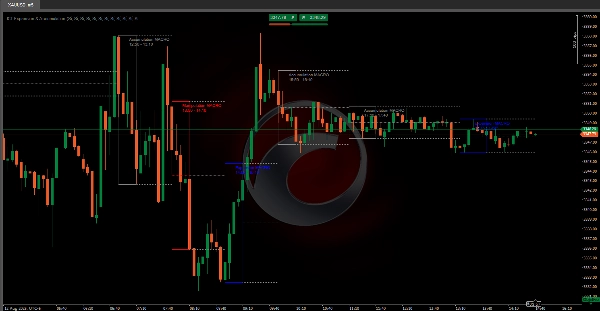
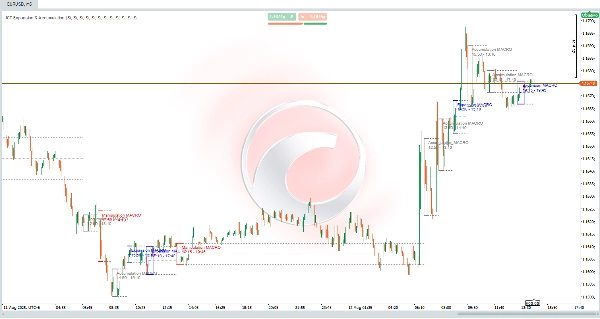
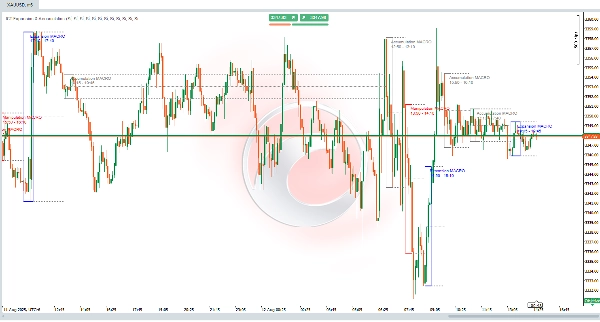
- 🟥 操控:当价格在买卖双方扫流动性时。
- 🟦 扩张:方向性移动在一侧获取流动性(与趋势一致)。
- 🟩 积累:价格在紧密区间“积累”流动性。
- 扩展关键水平:
-
- 绘制每个宏观会话的高点/低点。
- 计算并将平均价格(中点)延伸到下一会话。
- 这些水平作为动态支撑/阻力(ICT中至关重要!)。
- 实时流动性检测:
-
- 使用1分钟数据识别精确枢轴点(与低时间框架相同)。
即将推出的增强功能与更新:
- 流动性扫荡检测:将识别之前的流动性扫荡(前日/周高低点)。
- 公平价值缺口(FVG):将检测并可视化公平价值缺口。
📊 ICT实用示例
纽约开盘场景(09:50-10:10):
- 会前:价格扫买方流动性(局部低点)。
- 会中:
-
- 分类为🟥 操控。
- 价格转为看跌结构。
- 会后:
-
- 延伸线标记会话高点的阻力位。
- 在RR 1:3区域拒绝交易。
✅ 忠于ICT原则:
“宏观不是完整策略,但通过识别算法将寻找流动性的地方来增加一致性。”
摘要
The indicator analyzes market structure and detects key macro sessions—London, New York, midday, and afternoon—recording exact ICT times. It classifies price behavior into three types of macros: Manipulation (price sweeps liquidity on both sides), Expansion (directional movement aligned with trend), and Accumulation (tight range where price accumulates liquidity). It also draws and extends session highs, lows, and average price levels to act as dynamic support and resistance.
Using 1-minute data, ICT MACRO THEORY detects precise pivots for real-time liquidity identification. While not a complete trading strategy, it adds confluence to trades by highlighting where algorithms seek liquidity. Planned updates include detection of liquidity sweeps and visualization of fair value gaps.
This tool is intended for traders seeking to incorporate ICT macro time concepts into their analysis for enhanced market structure insight and liquidity detection on very short timeframes.