Indicator
Indices
Prop
Commodities
Stocks
Forex
Crypto
4MA
"4MA" logo
5.0
23/09/2025
429
Desktop
Since 22/09/2024
Sales
91
Free installs
8390
"4MA" uploaded image"4MA" uploaded image"4MA" uploaded image

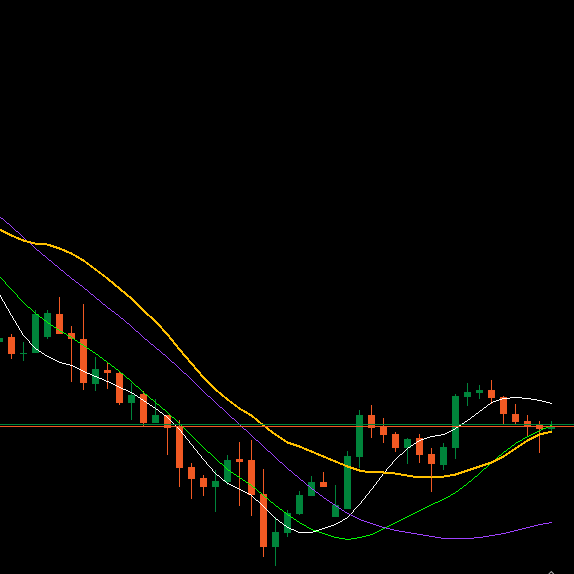
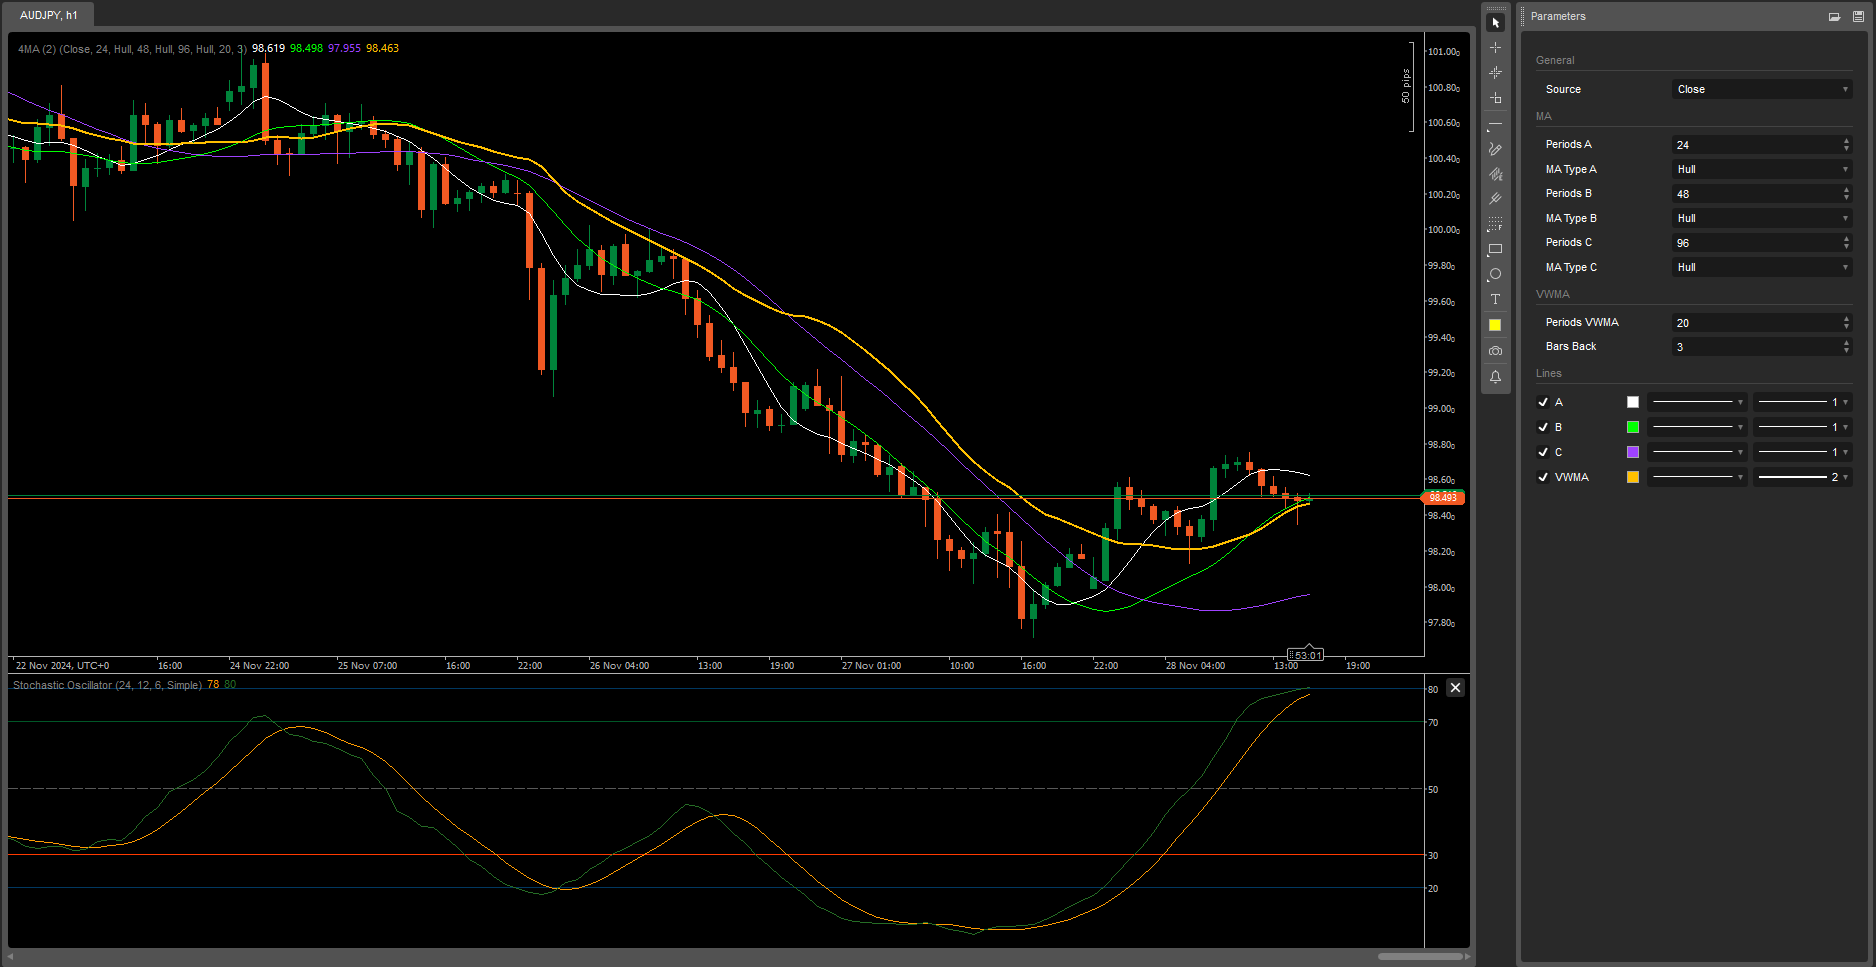
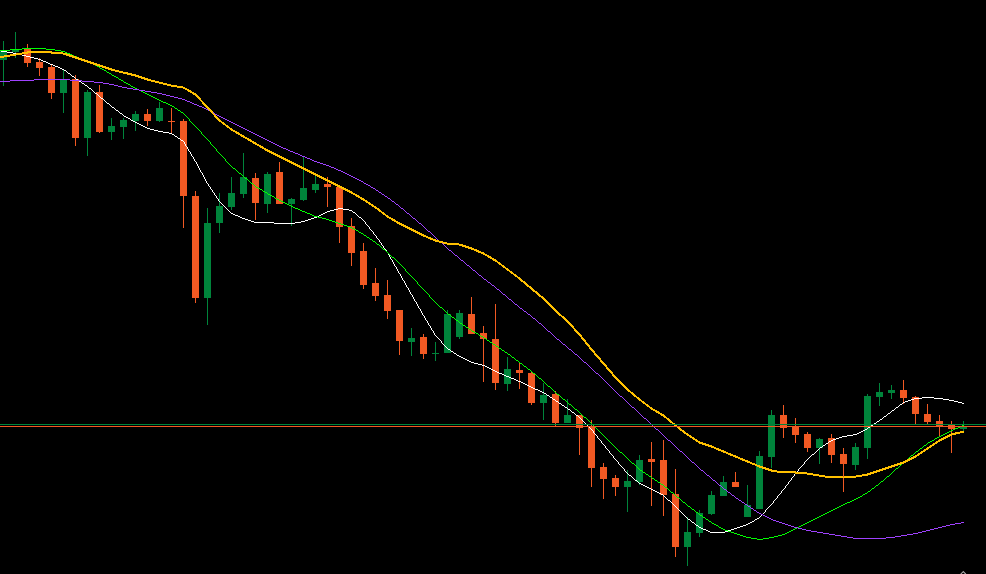
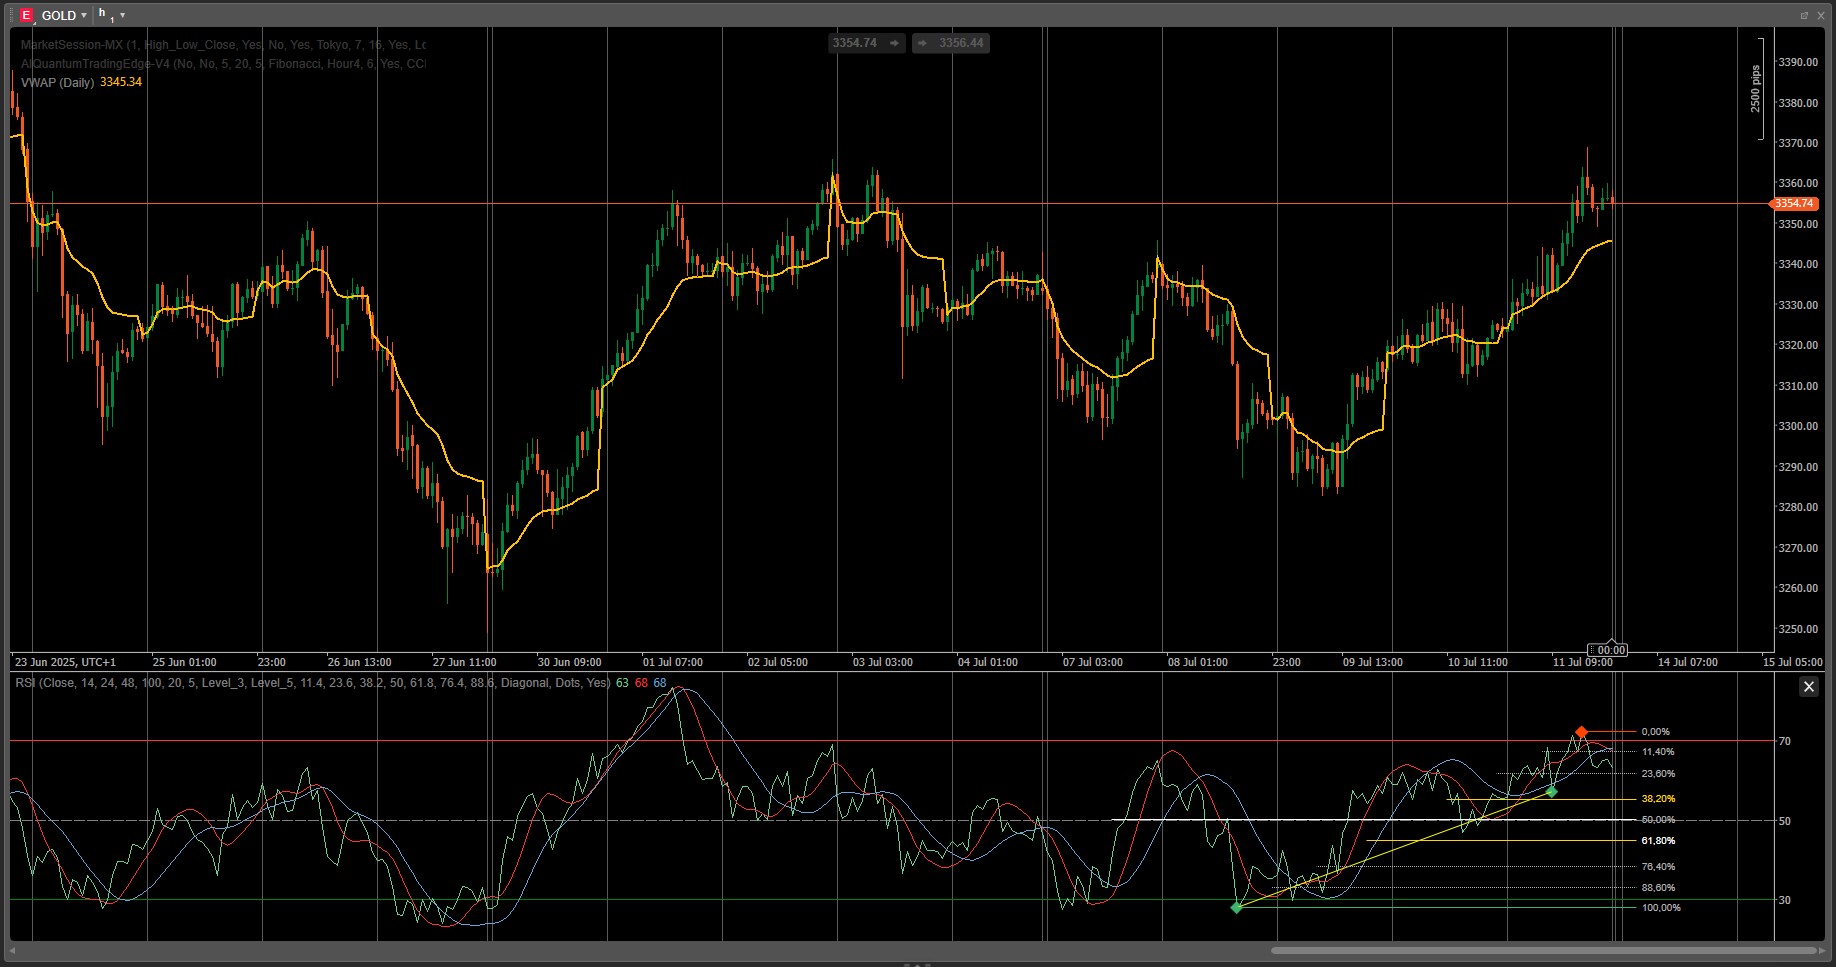
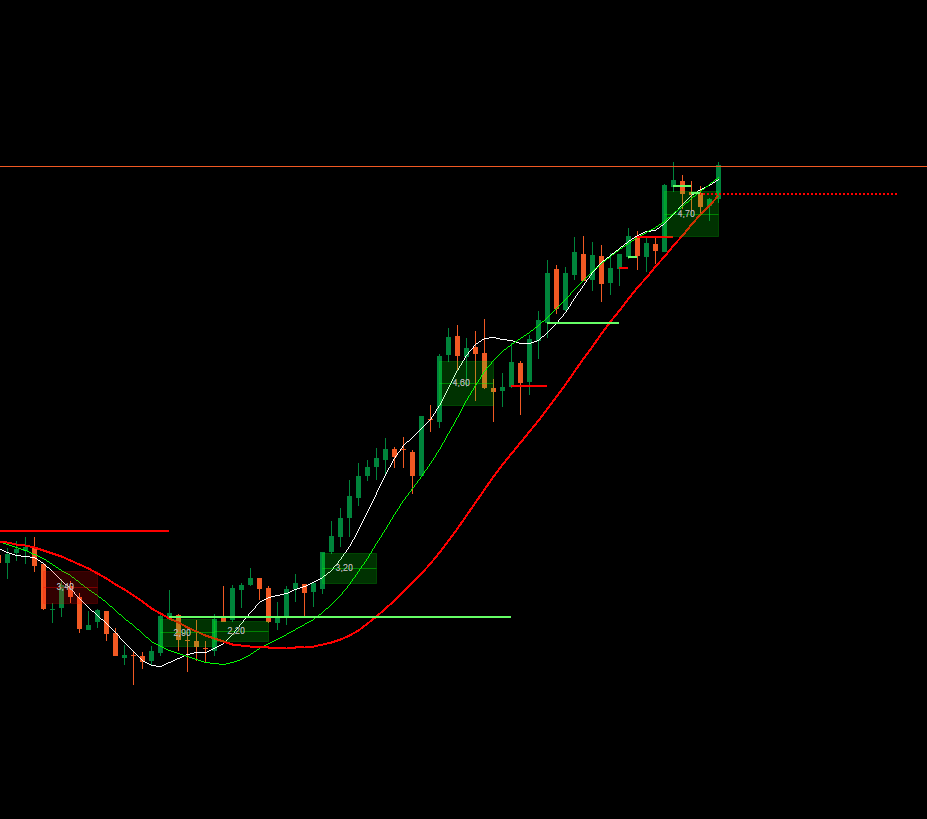
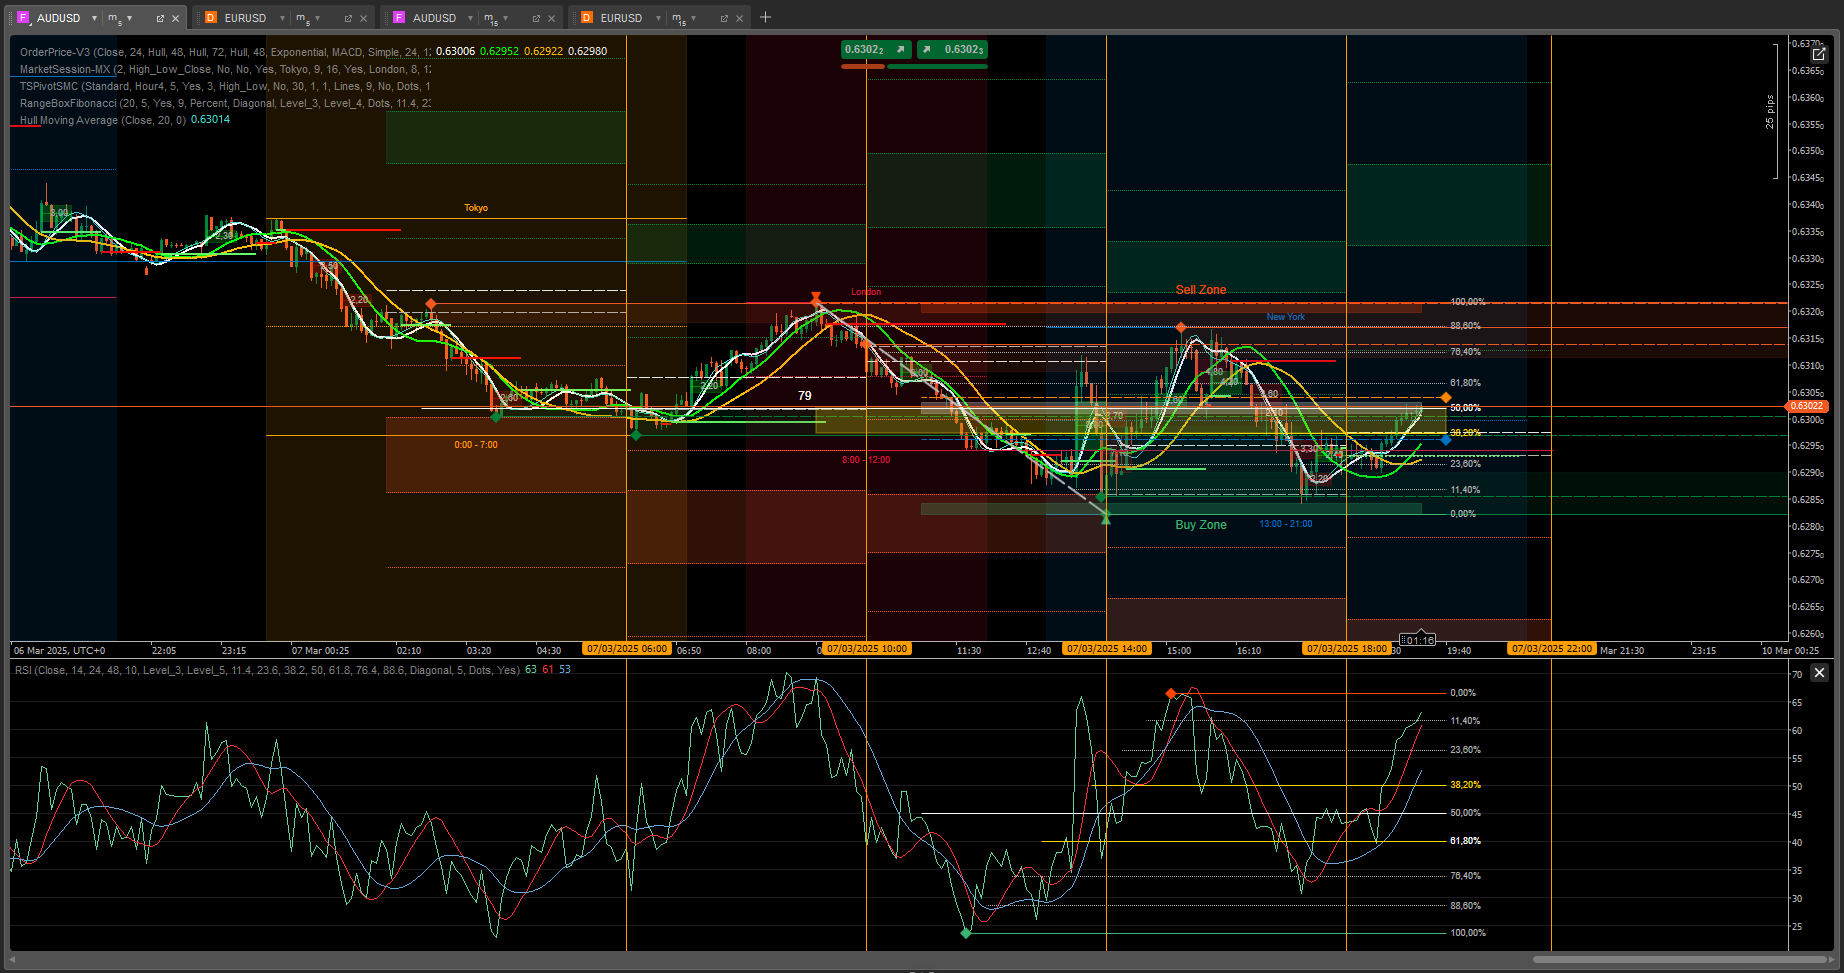
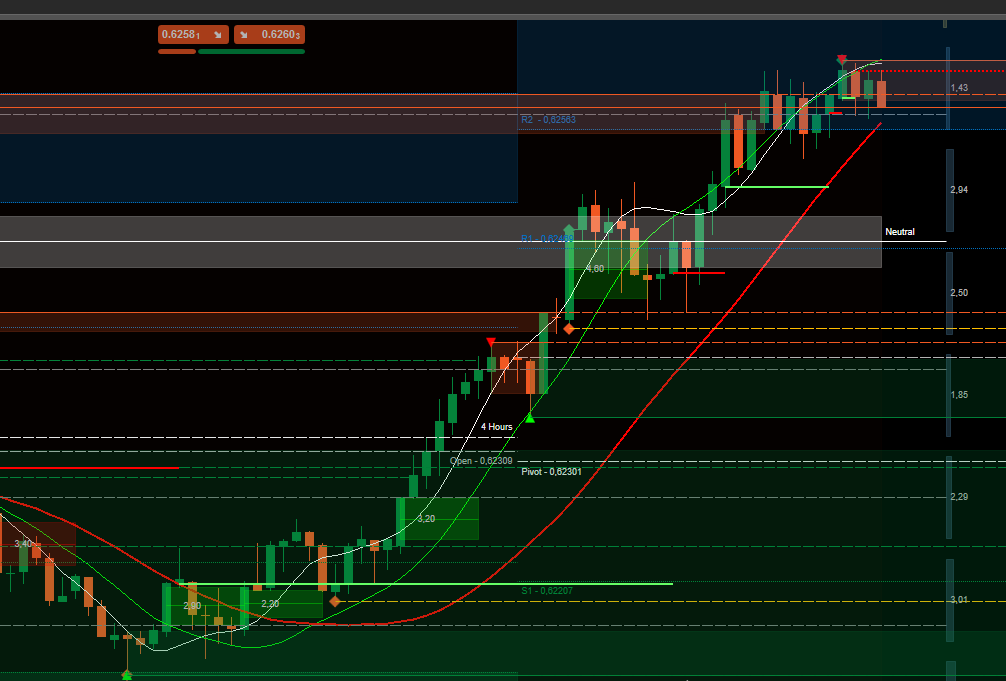
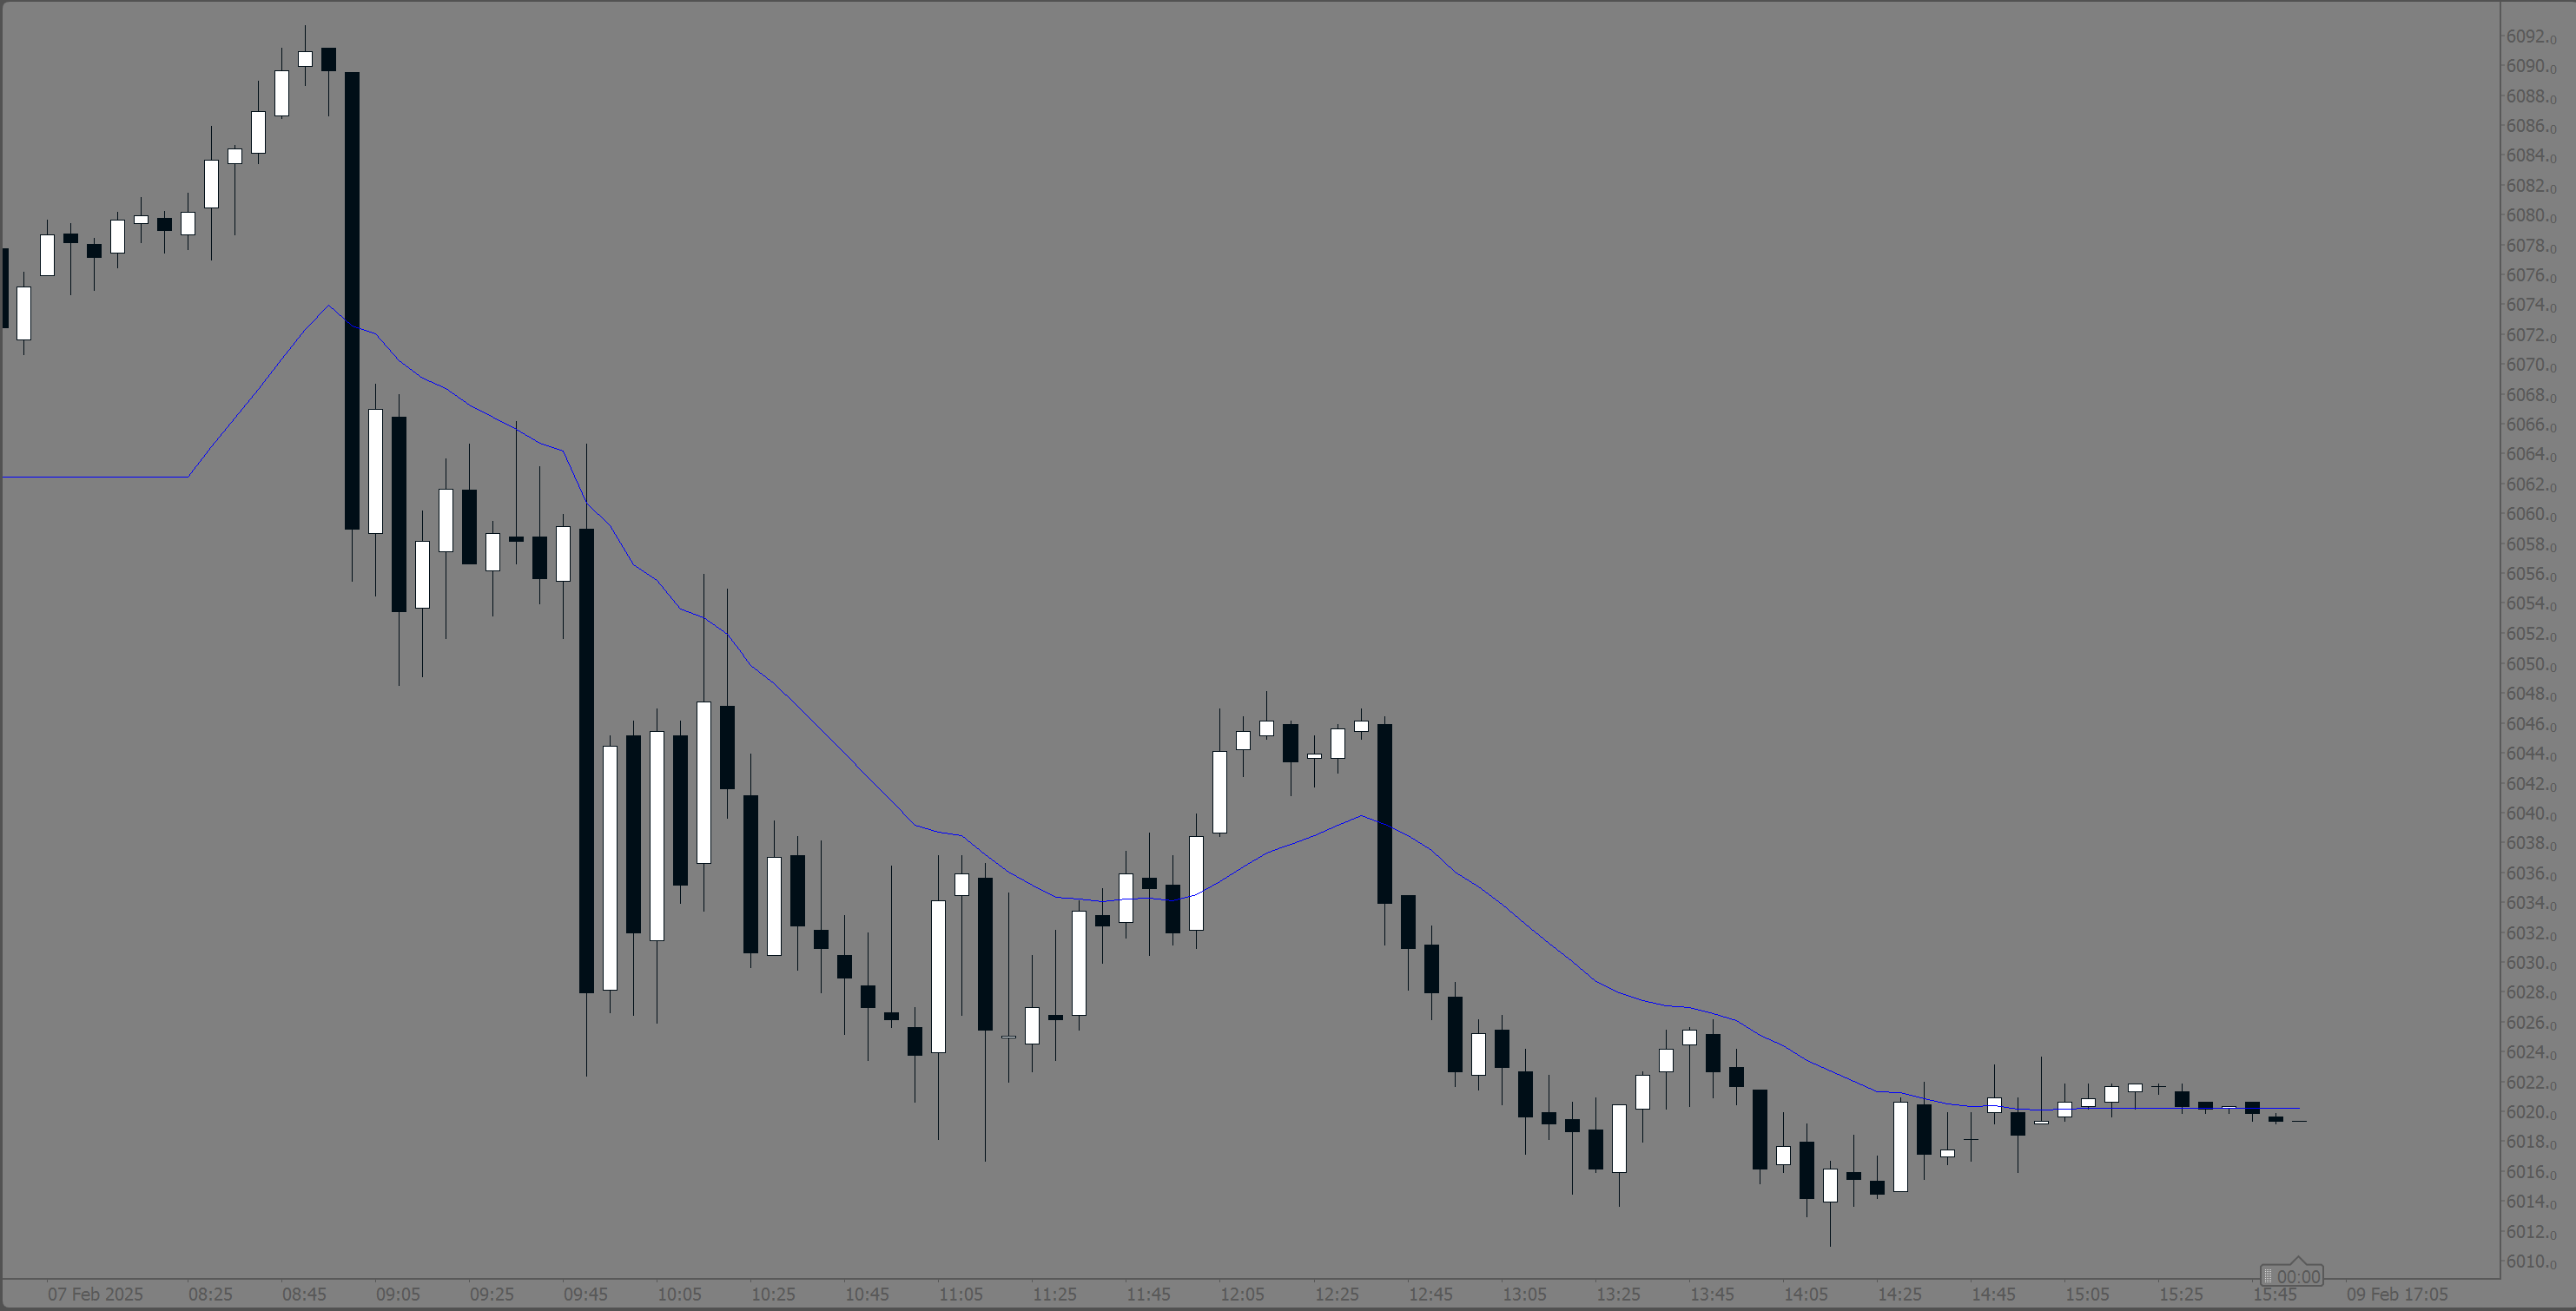
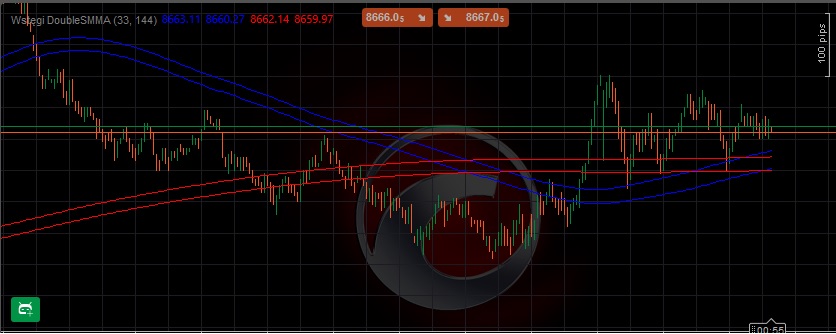
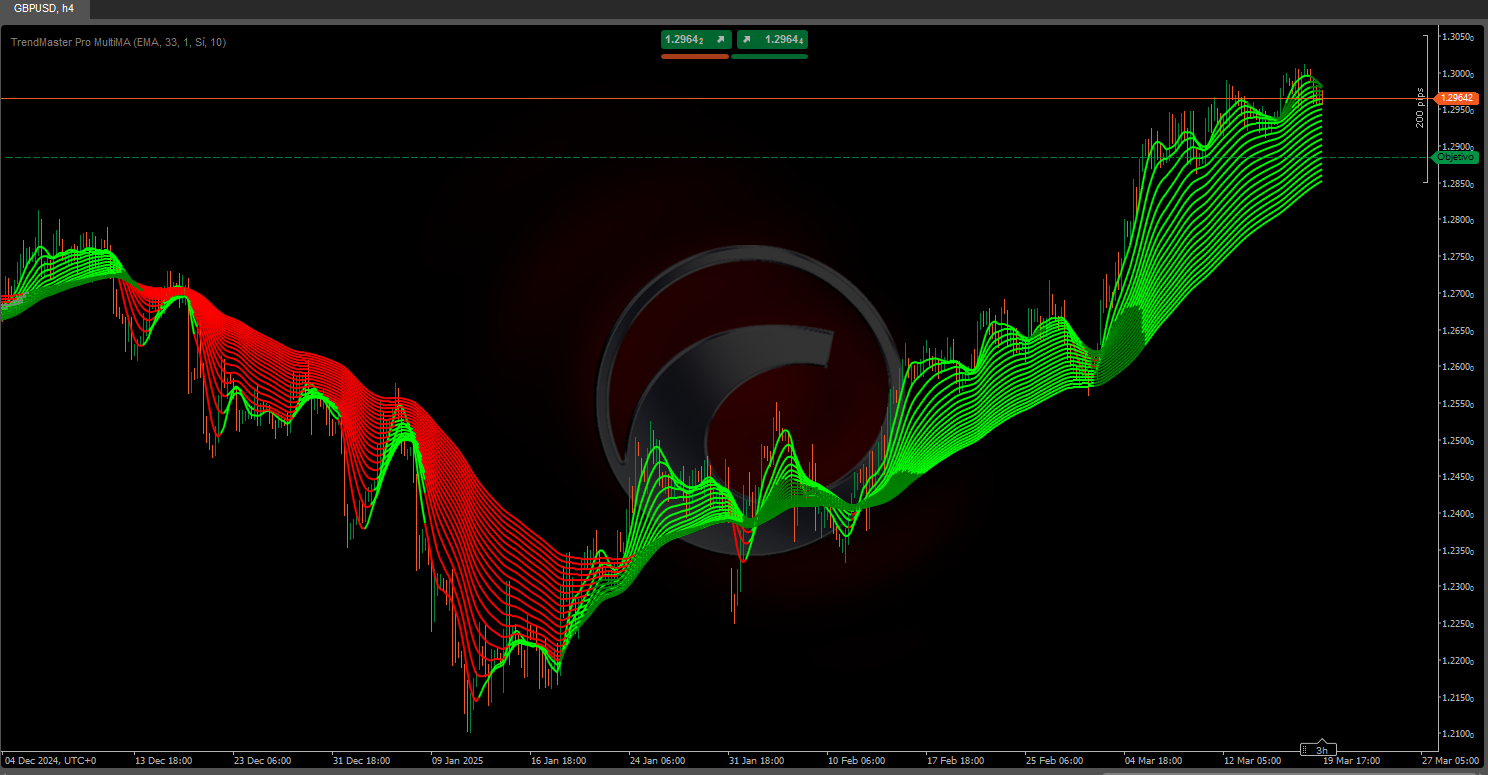
This indicator consists of 3 moving averages that can be configured to your liking, from the type of moving average to its colors, thickness, and line type.

The fourth is VWMA (Volume-Weighted Moving Average) – the typical formula for this indicator is - 3-day VWMA = (C1 * V1 + C2 * V2 + C3 * V3) / (V1 + V2 + V3).

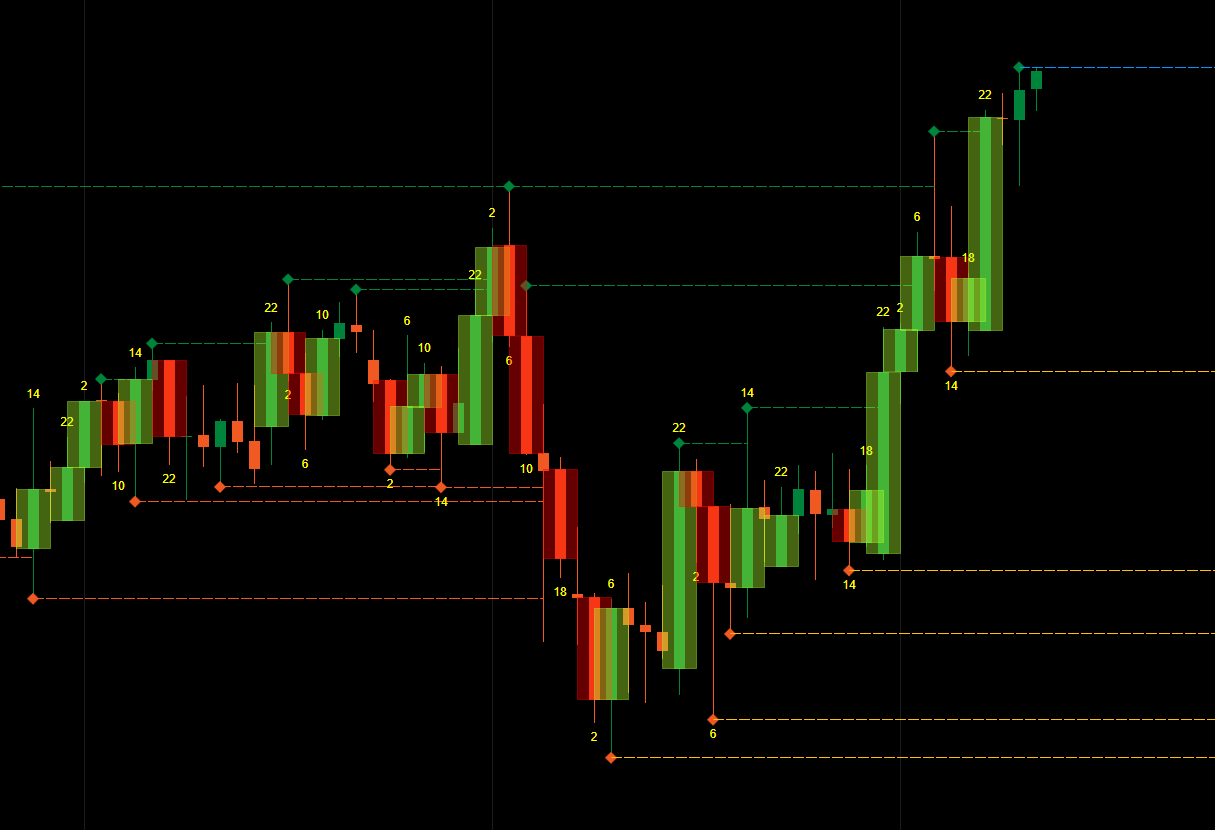
In this option, I have created the possibility to repeat the interval not just 3 times but up to 500 times.

I created this to keep the chart clean.

The default parameters are moving average hull which are perfect and periods 24, 48, 96 are more optimal for me in each timeframe.

Additional

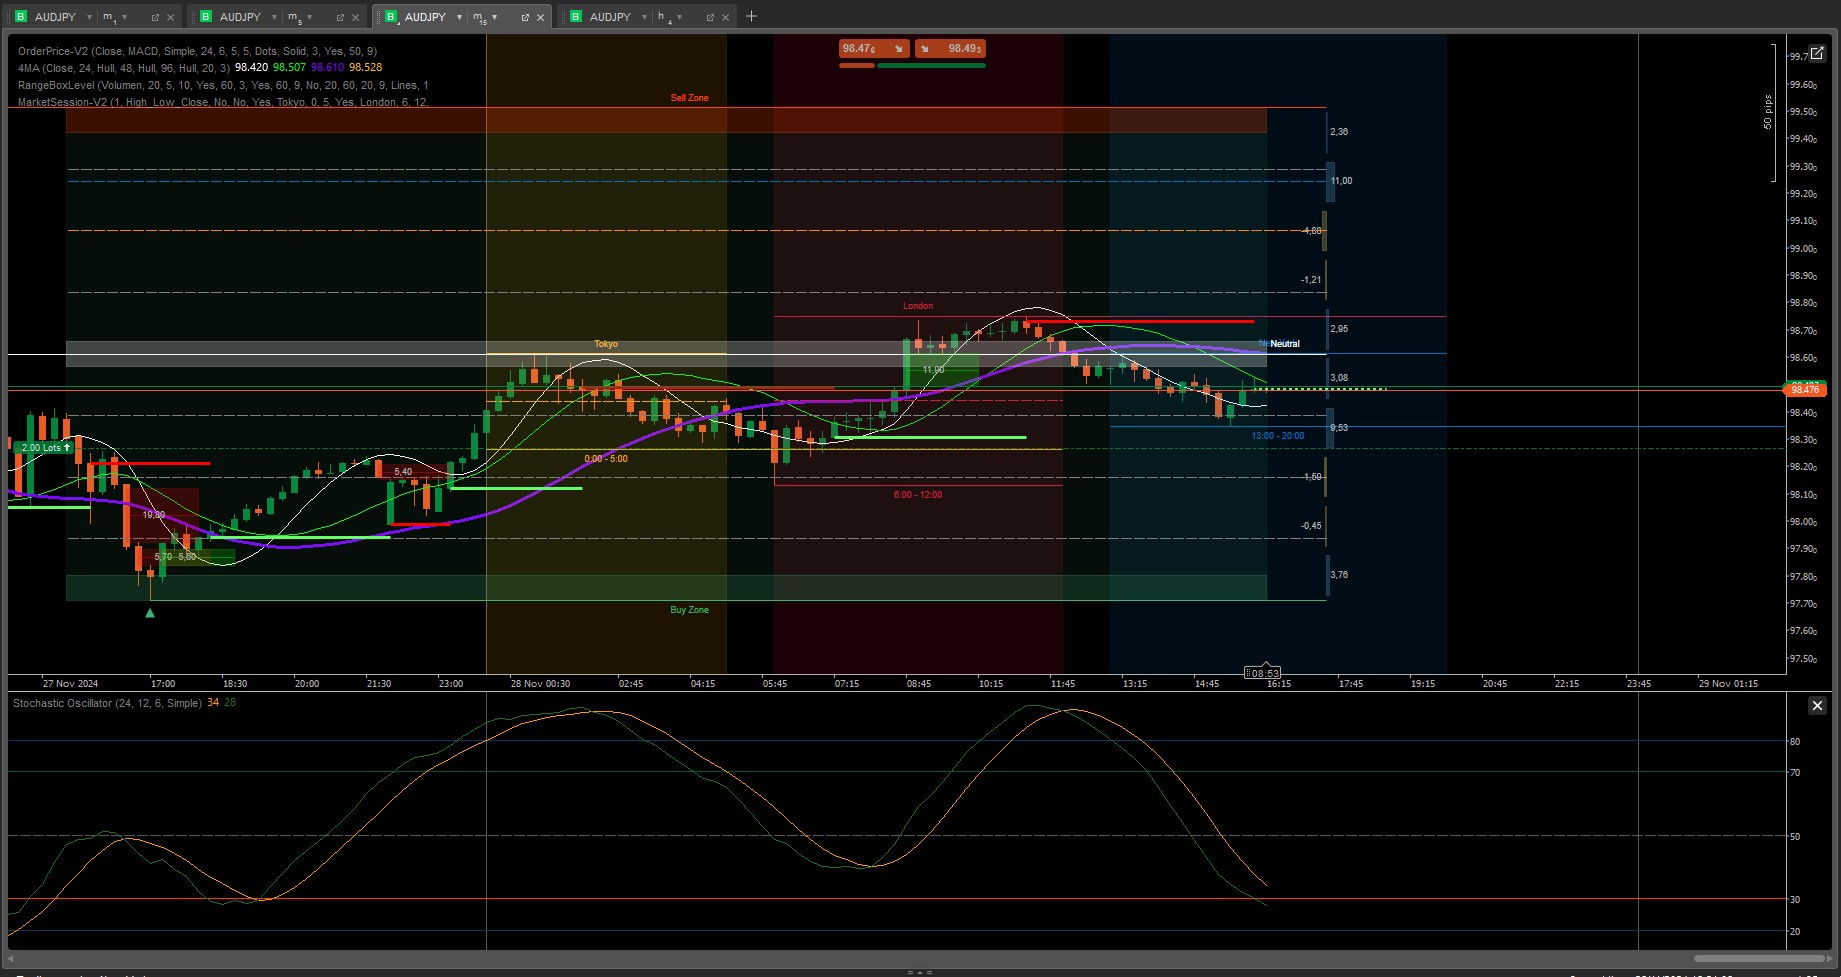
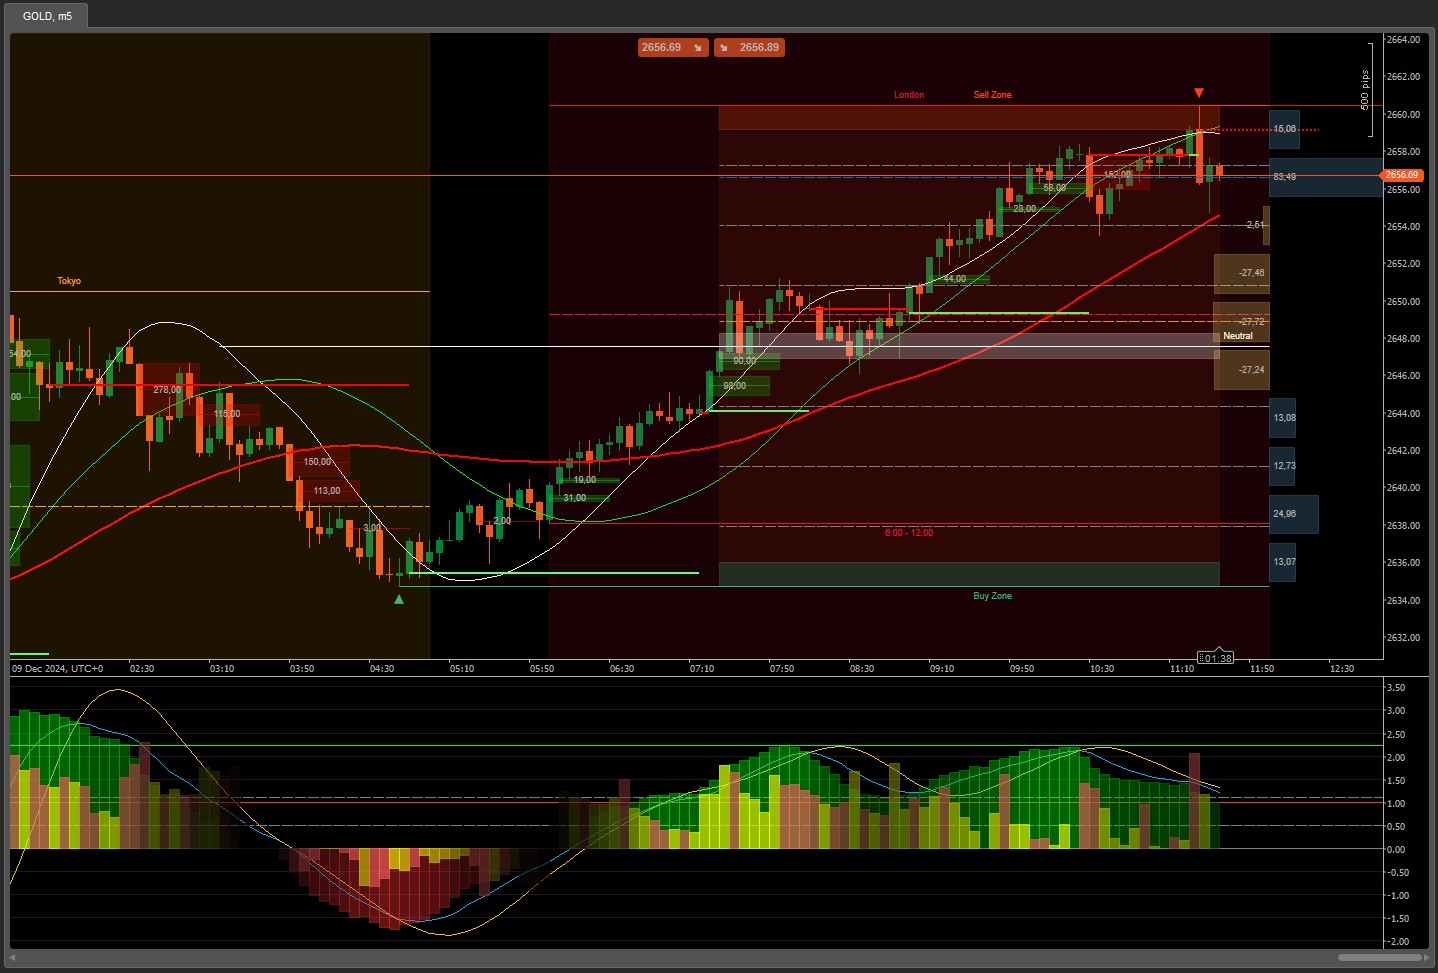
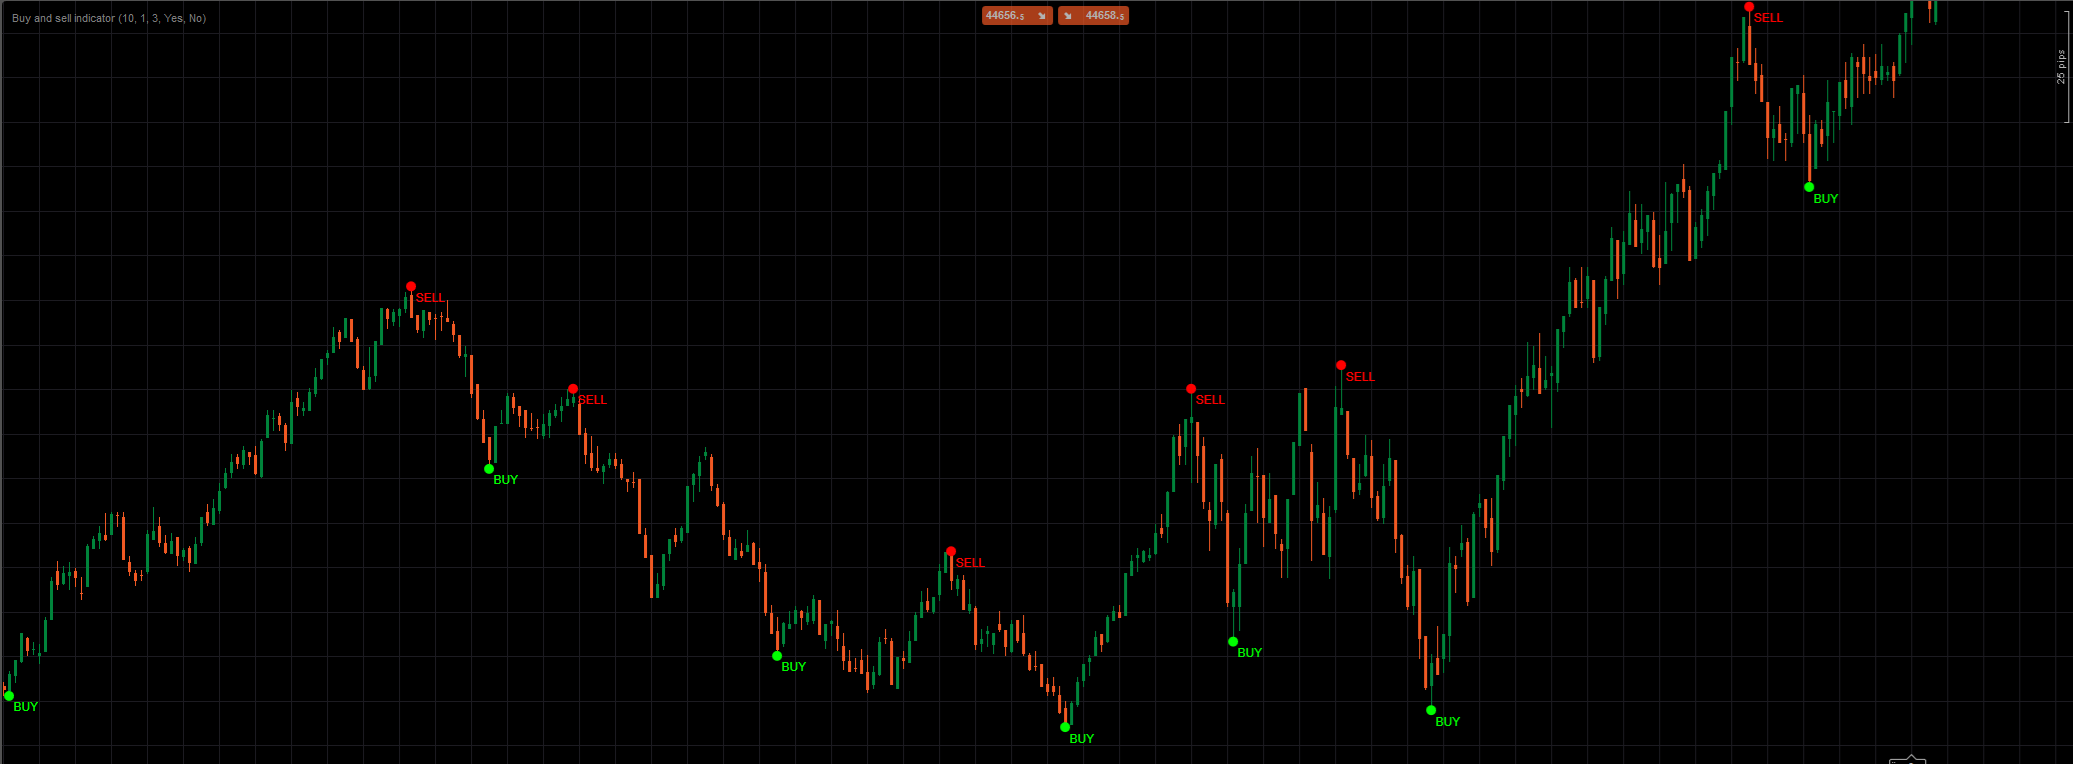
With these tools you can stop worrying about what the market is going to do, with a simple glance you will know – buy or sell and move on to another task.

FiboTrend-Pro: https://ctrader.com/products/653

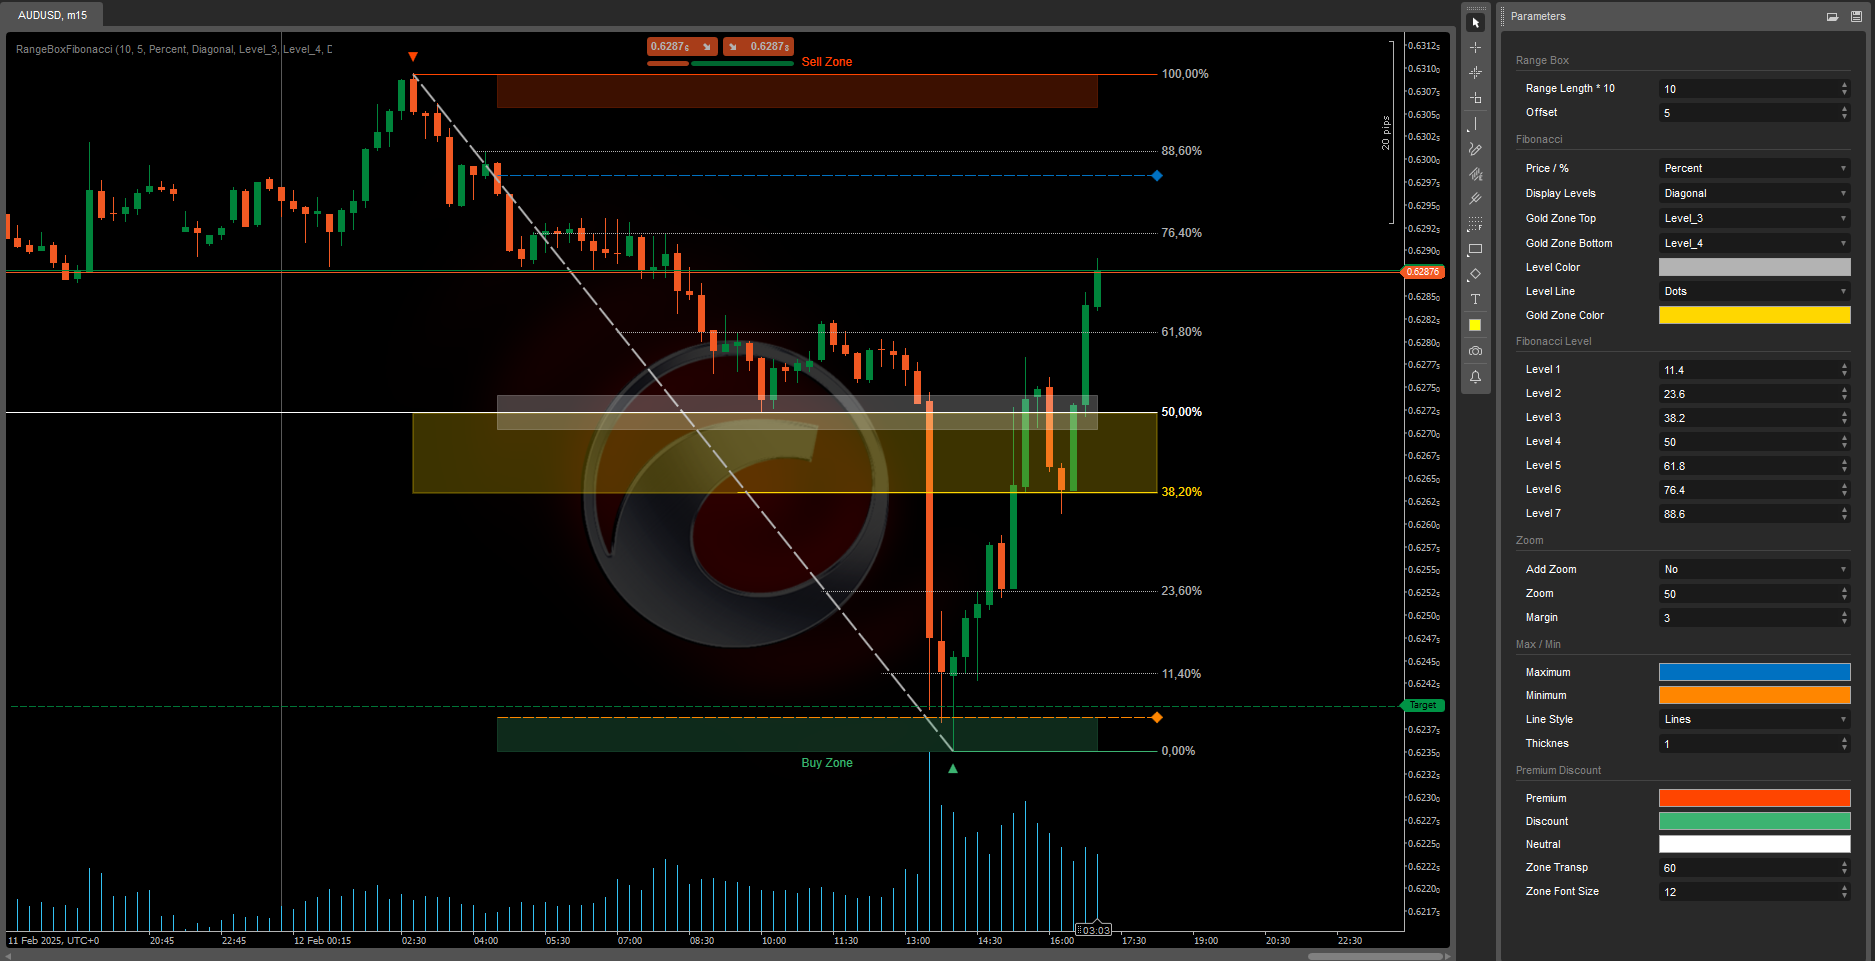
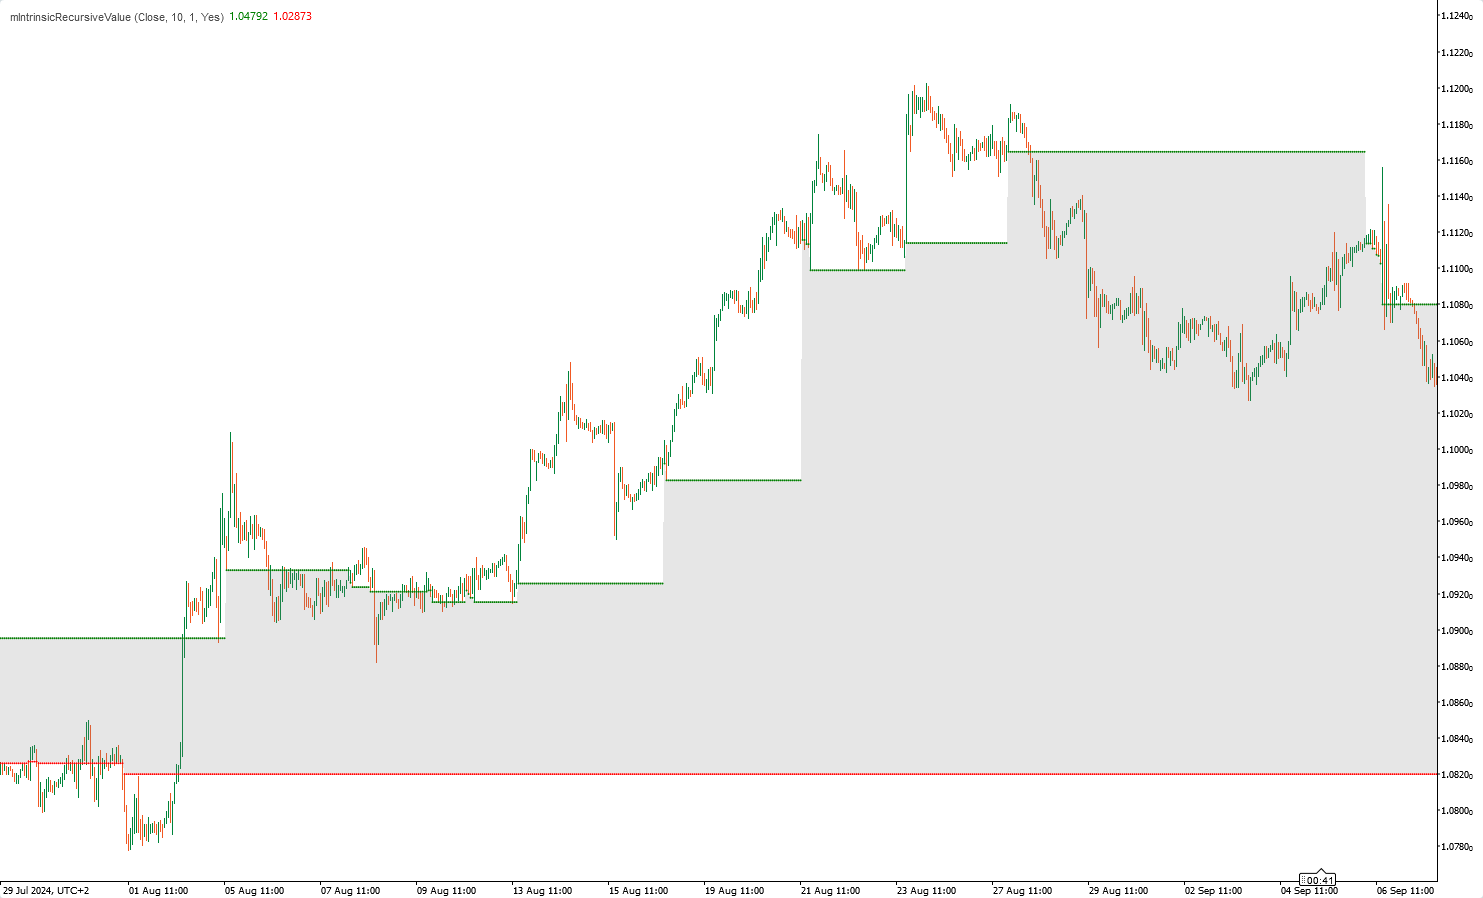
RangeBoxFibonacci: https://ctrader.com/products/526

OrderPrice-V3: https://ctrader.com/products/397

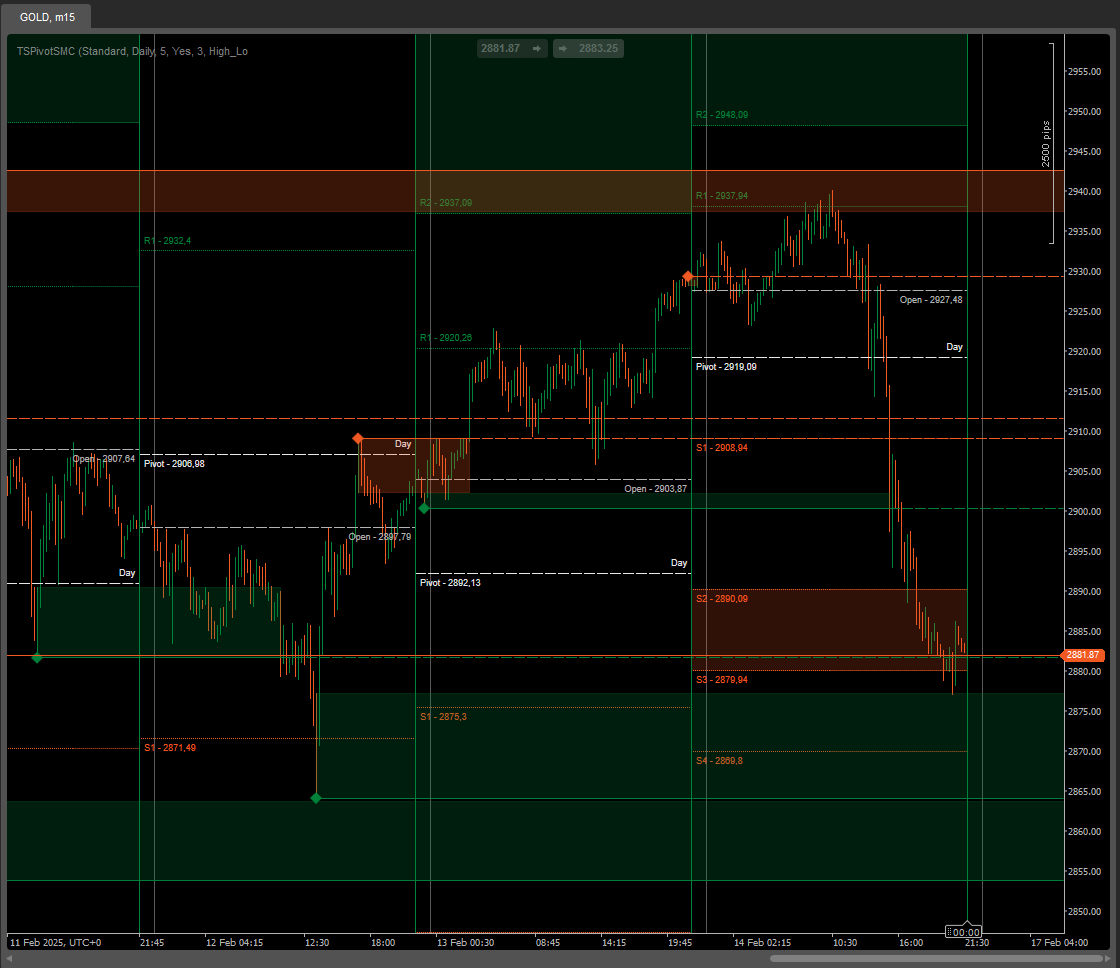
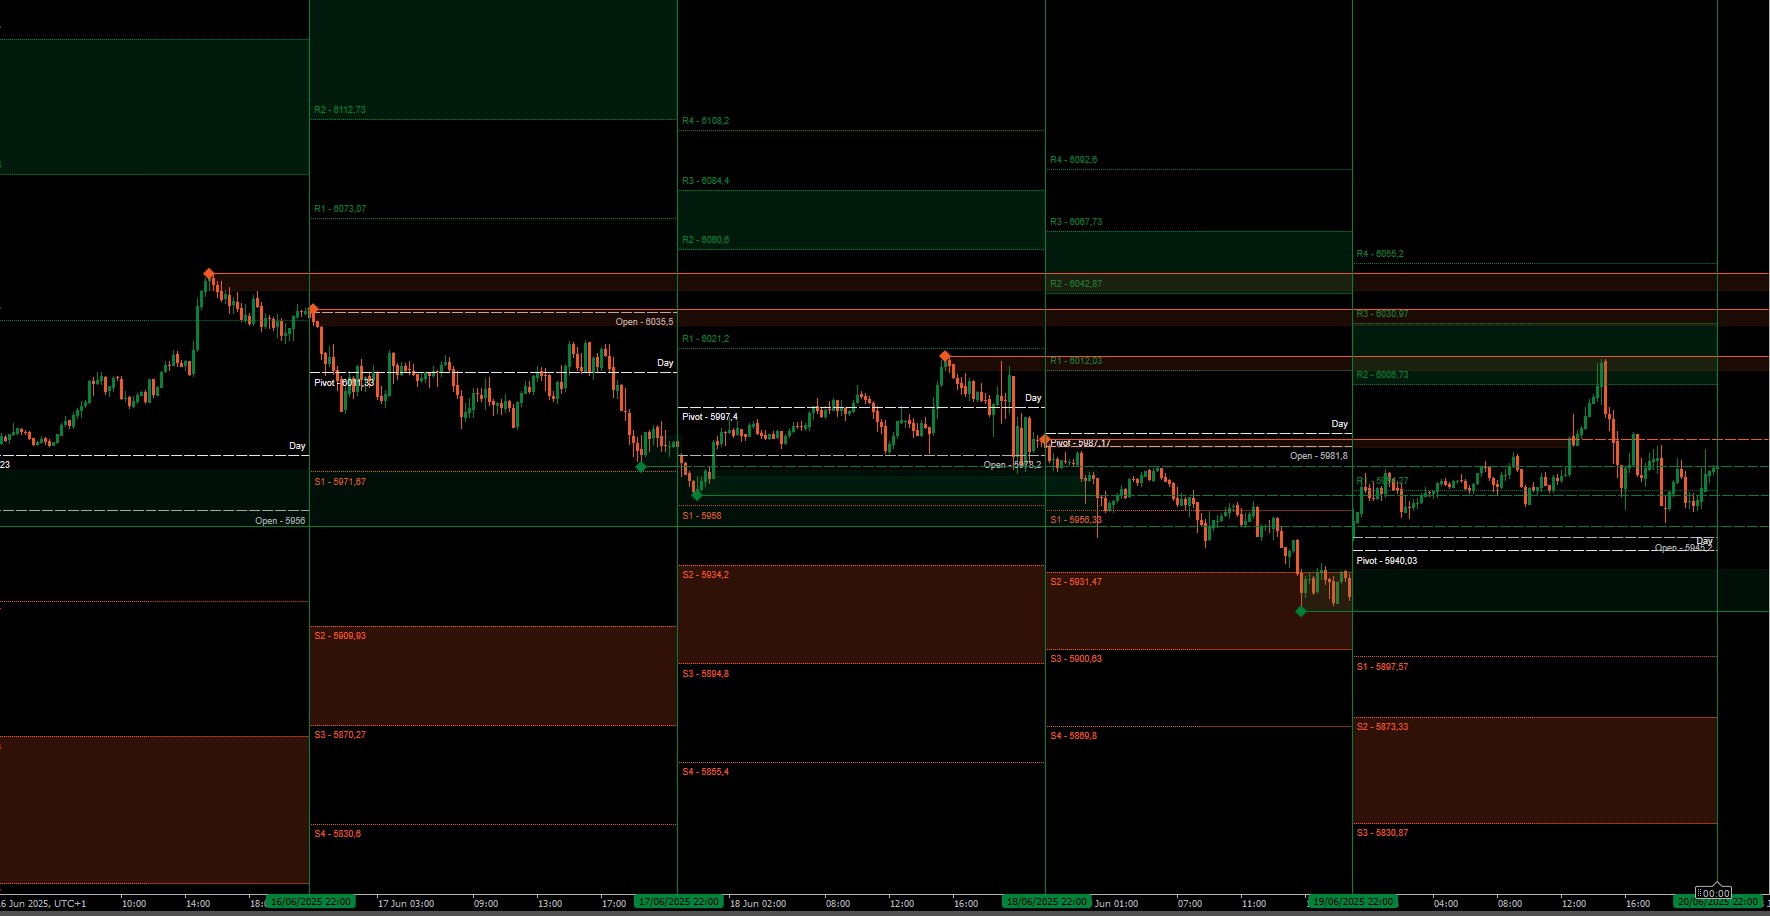
TSPivotSMC https://ctrader.com/products/544

And for choosing

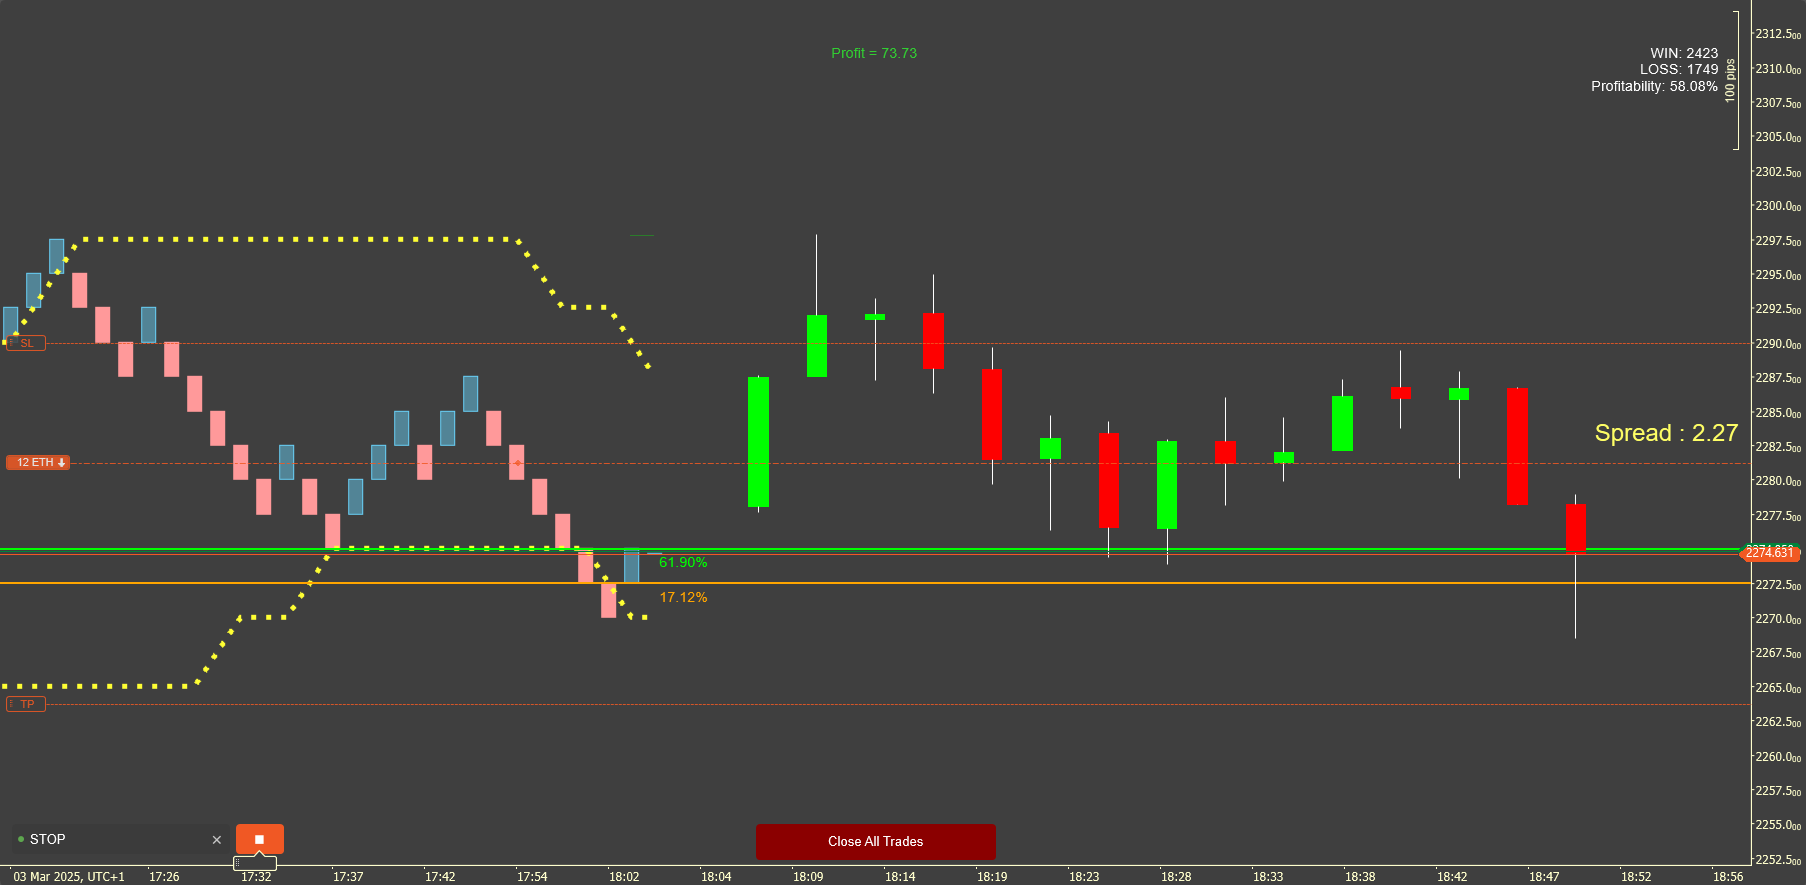
NTMPICLL https://ctrader.com/products/327

MacdVolume https://ctrader.com/products/267

MarketSession-MX: https://ctrader.com/products/525

You will be invincible

Good luck 😀

More from this author
VWAP-Free
VWAP only timeframe
Indicator
NAS100
NZDUSD
XAUUSD
+10
MarketSession-MX
😎Read the description before purchasing💩
cBot
Commodities
MACD
SparrowBot-FreeTrial-V2
This bot can automatically generate buy and sell orders based on three specific Fixed bugs
Indicator
Grid
NAS100
NZDUSD
+15
RangeBoxLevel
This technical analysis indicator provides information on market sentiment, trend and price levels....
Indicator
NAS100
NZDUSD
XAUUSD
+11
SessionOne
Session One is a tool for marking from to, useful if you've set the hours you want to trade
Indicator
Stocks
Forex
MACD
MACDVolume
😎Read the description before purchasing💩
Indicator
Grid
NAS100
NZDUSD
+16
AllPattern
🔍 Discover All Candlestick Patterns… Absolutely Free!
Indicator
Grid
NAS100
NZDUSD
+15
RangeBoxFibonacci
With this Fibonacci retracement indicator, traders have full control over the retracement levels displayed on the chart.
Indicator
Indices
Prop
Stocks
+5
New Way Sar - Free
The Parabolic SAR, or "Stop and Reverse," is a dynamic technical analysis tool
Indicator
Grid
Indices
Prop
+8
TSPivotSMC
Pivot Point MultiTimeFrame with Order Block
Indicator
Indices
RSI
Commodities
+1
OrderPrice-V3
A straightforward yet effective tool signals entry points for both buying and selling. Include 3 Moving Average
Indicator
RSI
Indices
Stocks
+3
FiboTrend-Pro
😎Read the description before purchasing💩
Indicator
Grid
NAS100
NZDUSD
+15
TS_Pivot
Those who are involved in trading know how important it is to take into account the previous session. With Order Block
Indicator
Indices
Prop
Breakout
+7
NTNPICLL
NTNPICLL is a tool to check the best trading hours for the assets and also includes the highest and lowest point
Indicator
NAS100
RSI
NZDUSD
+18
HAIQuantum-V10
The HAI Quantum V10 is an advanced indicator designed for technical analysis
Plugin
Breakout
Signal
RiskRewardCalculator
The Risk-Reward plugin is a tool to visualize a trading idea based on other analysis tools,
Indicator
Indices
Prop
Stocks
+4
Pivot Point Smart Money Concept
Transform your approach to trading with our innovative Pivot Point Indicator.
Indicator
Indices
Prop
Stocks
+6
New Way Sar - Pro
The Parabolic SAR, or "Stop and Reverse," is a dynamic technical analysis tool
You may also like
Indicator
Signal
Scalping
Nadaraya-Watson Indicator
MTF Candles
Multi Timeframe Candle drawing. Draw Any candles from any timeframe on your chart :-)
mIntrinsicRecursiveValue
Intrinsic Recursive Value Indicator
E7 Harmonic Structures Basic
E7 Harmonic Structures Basic.
Reversal Probability Engine
Detecting reversal zones + multidimensional mapping of support and resistance "Golden Levels.
Indicator
Grid
Indices
Prop
+4
Round Numbers
Automatically draws major, minor, and trace support/resistance levels at round numbers
Vishal Volume Profile v2.0
Volume Profile plots traded volume at each price level, highlighting high activity zones of precise support & resistance
Indicator
NAS100
EURUSD
GBPUSD
Ema
An exponential moving average based on regular trading hours.
VolumeThermometer
Heatmap of intra-HTF volume (POC/VA) built from LTF tick data; paints current candle and auto-loads visible history.
Buy and sell indicator
Buy and Sell Signals
Indicator
RSI
Breakout
XAUUSD
+5
Supertrend
💹 Define a price channel 📈 and determine trend direction (bullish 🟢 or bearish 🔴).
period seperate
daily period separate indicator.
Fx4U.Multi Trend Line Indicator
Allow trader to draw multi trendlines in different timeframes on one chart,Give trader an overview of the current market
Indicator
RSI
Breakout
Supertrend
TrendMaster Pro MultiMA
Connects each moving average value from candle to candle, forming a fan-like structure of trendlines.
Indicator
Indices
Breakout
Supertrend
[CB] Pivot Points Pro
You can use the cTrader Pivot Points Pro indicator to find a good pullback entry in a trend
Indicator
Breakout
AutoLines™ Support & Resistance
FlexSR auto‑detects pivot highs/lows to plot dynamic support & resistance lines Features customizable styling and option
Previous Day Equilibrium (Premium & Discount)
Plots the equilibrium price levels based on previous daily highs and lows.