Brokers & props
For business
00
Days
:
00
Hours
:
00
Minutes
:
00
Seconds
Indicator
RSI
MACD
Multi-Timeframe Market Levels
5.0
03/09/2025
10
Desktop
Since 22/11/2024
Sales
73
Free installs
2063
"Multi-Timeframe Market Levels" uploaded image"Multi-Timeframe Market Levels" uploaded image"Multi-Timeframe Market Levels" uploaded image"Multi-Timeframe Market Levels" uploaded image"Multi-Timeframe Market Levels" uploaded image

Enhanced Support Resistance Indicator

Unlock the power of technical analysis with our Enhanced Support Resistance Indicator for cAlgo. This advanced tool is designed to help traders identify and visualize critical support and resistance levels on their trading charts, enhancing decision-making and trading strategies.

Key Features:

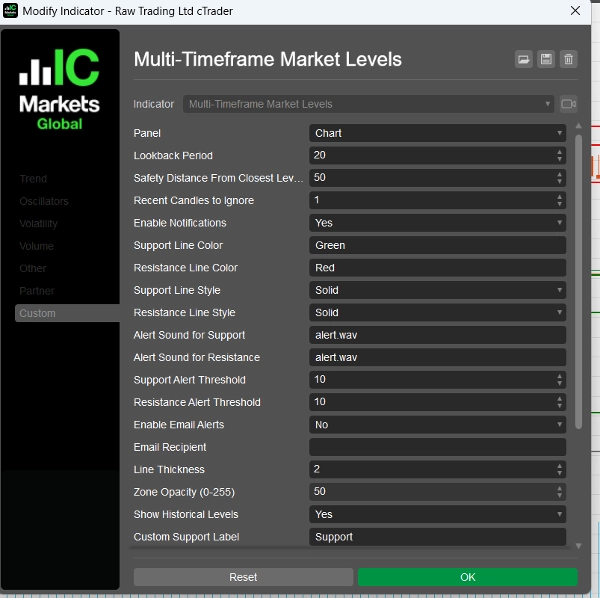
  • Customizable Parameters: Tailor the indicator to your trading style with adjustable settings, including lookback periods, safety distances, alert sounds, and more.
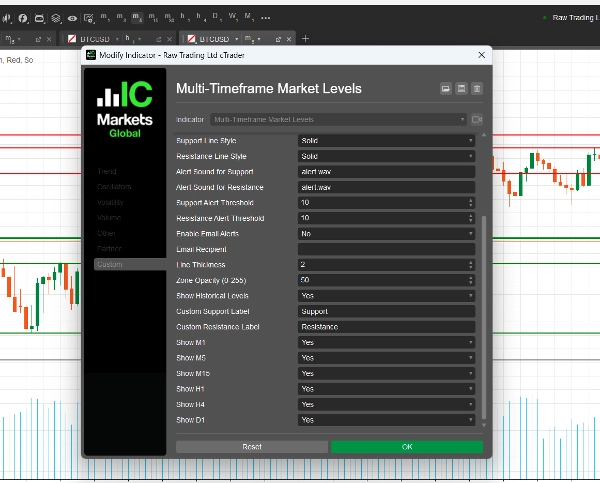
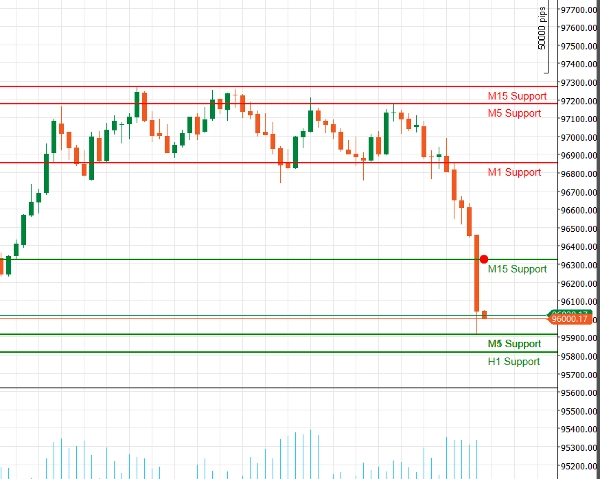
  • Multi-Timeframe Support: Analyze multiple timeframes simultaneously (M1, M5, M15, H1, H4, D1) to gain a comprehensive view of market dynamics and identify key levels across different trading horizons.
  • Real-Time Alerts: Stay informed with instant notifications! The indicator can send audio alerts and email notifications when the price approaches critical support or resistance levels, ensuring you never miss a trading opportunity.
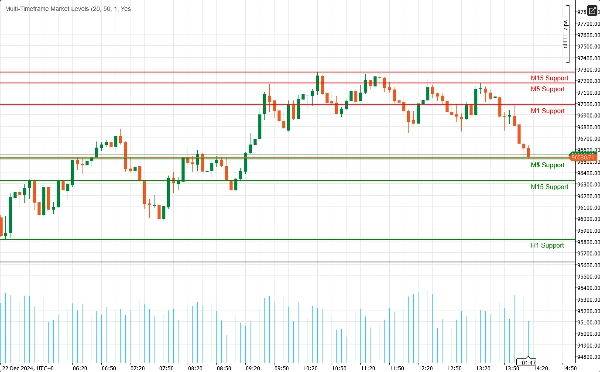
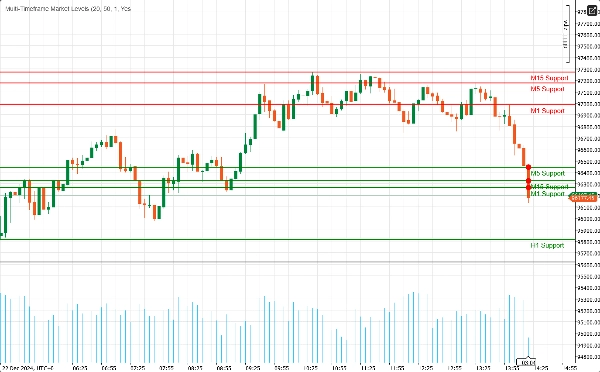
  • Visual Clarity: Enjoy clear visual representations of support and resistance levels, complete with customizable colors and line styles. Highlighted zones provide additional context, making it easier to spot potential reversal points.
  • Fibonacci Integration: Enhance your analysis with built-in Fibonacci level drawing, allowing you to identify potential retracement and extension levels in conjunction with support and resistance.
  • User-Friendly Interface: Designed for both novice and experienced traders, the indicator is easy to set up and integrates seamlessly into your existing cAlgo environment.

How to Use the Enhanced Support Resistance Indicator

  1. Installation:
    • Download the indicator and import it into your cAlgo platform.
    • Attach the indicator to your desired chart.
  2. Configure Parameters:
    • Adjust the settings to fit your trading style. Set the lookback period, safety distance, and choose your preferred colors and line styles for support and resistance levels.
    • Enable notifications if you wish to receive alerts when the price approaches these levels.
  3. Select Timeframes:
    • Choose which timeframes you want to display. You can opt to show or hide levels from M1, M5, M15, H1, H4, and D1, depending on your trading strategy.
  4. Analyze the Chart:
    • Observe the support and resistance levels drawn on your chart. These levels indicate where the price is likely to reverse or consolidate.

How to Trade with the Enhanced Support Resistance Indicator

  1. Identifying Entry Points:
    • Long Trades: Look for buying opportunities when the price approaches a support level, especially if it shows signs of bouncing back (e.g., bullish candlestick patterns).
    • Short Trades: Consider selling when the price nears a resistance level, particularly if there are bearish signals (e.g., bearish candlestick patterns).
  2. Using Alerts:
    • Utilize the real-time alerts to notify you when the price approaches key support or resistance levels. This allows you to act quickly and capitalize on potential trading opportunities.
  3. Combining with Other Indicators:
    • Enhance your strategy by combining the Enhanced Support Resistance Indicator with other technical indicators (e.g., Moving Averages, RSI, MACD) to confirm signals and improve the accuracy of your trades.
  4. Setting Stop-Loss and Take-Profit Levels:
    • Place stop-loss orders just below support levels for long trades and just above resistance levels for short trades to manage risk.
    • Set take-profit targets at the next significant support or resistance level to maximize potential gains.

Why Choose Enhanced Support Resistance?

Navigating the complexities of the financial markets can be challenging. The Enhanced Support Resistance Indicator equips you with the tools you need to identify key price levels and make informed trading decisions. Whether you’re a day trader or a long-term investor, this indicator is an essential addition to your trading toolkit.

5.0
Reviews: 1
5
100 %
4
0 %
3
0 %
2
0 %
1
0 %
Customer reviews
August 18, 2025
Displays support/resistance levels from multiple timeframes in one chart. Clear visual hierarchy and flexible settings. Cons: No alerts or tooltips. Can't save presets or filter levels dynamically.
More from this author
Indicator
RSI
Indices
Stocks
+3
Advanced RSI Indicator
Advanced RSI Indicator with multi-MA smoothing, Bollinger Bands, divergence detection, and fill zones for cTrader.
Indicator
NAS100
NZDUSD
Martingale
+26
Support & Resistance Pro
The Support & Resistance Pro helps traders identify key support and resistance levels for informed trading decisions.
FibonacciStrategyCBot
FiboSmart cBot automates Fibonacci-based trading with trend, RSI, and MACD filters, plus built-in money management, trai
Indicator
ATR
Stocks
Commodities
+2
LevelMaster SR
LevelMaster S/R: Pinpoint key support & resistance zones with precision. Perfect for traders of all levels Trade smarter
Indicator
Indices
Stocks
Forex
+4
MACD Pro Trader
🚀 MACD Pro Trader – Advanced MACD with buy/sell signals, custom MAs & color-coded histograms for smarter trading! 📈🔥
Indicator
VWAP
Indices
RSI
+4
ProVWAP
Advanced Anchored VWAP for cTrader: volatility bands, real‑time alerts & customizable session resets.
Indicator
Signal
MACD
TradingViewMACD
Enhance your trading strategy with our customizable TradingViewMACD indicator. Optimize and elevate your market analysis
Indicator
Breakout
AutoLines™ Support & Resistance
FlexSR auto‑detects pivot highs/lows to plot dynamic support & resistance lines Features customizable styling and option
Indicator
RSI
EURUSD
MACD
Supply&Demand
Precision Supply & Demand zones indicator—automatically plots key buy/sell areas on your chart for smarter entries.
Indicator
RSI
Breakout
XAUUSD
+1
ZigzagSR
Automatic ZigZag swings with dynamic support & resistance levels, labeling highs/lows for clear trend signals.
SmartFibonacci
SmartFibonacci — automatic Fibonacci retracements & extensions with swing detection, alerts and clean labels for cTrader
Indicator
NAS100
NZDUSD
Martingale
+26
ICT Killzones
Complete ICT Killzones: 5 sessions, easy colors, transparency controls & session info. Professional timing for cTrader.
Indicator
NAS100
Martingale
Forex
+25
Fair Value Gap Pro+
Exploit market imbalances with auto FVG zones—fade, extend, and filter with precision.
Indicator
Grid
NAS100
RSI
+19
Smart Volume Delta
Detects smart money activity using advanced tick volume and price divergence analysis.
cBot
Grid
NAS100
Breakout
+16
ICT Fibonacci Killzone cBot
Automated ICT-based Fibonacci trading bot designed for precision entries during key market killzones.
Indicator
Breakout
Stocks
Commodities
+1
Advanced Donchian Zones
MTF Donchian: Identify trend breakouts & key zones with precision. Perfect for swing & day traders seeking accuracy!
Indicator
NAS100
NZDUSD
Martingale
+26
Smart Money Gaps
Smart Money Gaps: MTF FVG auto-detection, extension, and mitigation marker. Trade institutional imbalances.
You may also like
SupertrendHTF
Overlay higher-timeframe SuperTrend to filter noise, follow real trends, and avoid lower-timeframe whipsaws. As
Indicator
Forex
EURUSD
EconomicForex
ECONOMIC FOREX:provides insights into inflation, nominal interest rates and real interest rates, in the line chart
Indicator
RSI
Breakout
Supertrend
+1
Reactive Moving Average
Combines SMA with dynamic correlation to adapt to market trends. Adjusts sensitivity, filters noise🚀📉
Indicator
NAS100
EURUSD
GBPUSD
Ema
An exponential moving average based on regular trading hours.
Indicator
XAUUSD
Commodities
ATR
+1
[Stellar Strategies] Visual Trend Momentum
Visual Trend Momentum is a MA/ATR/Volume trend tool. Visual signals for strong trends & reversals. Customizable. 📈📉
Indicator
NAS100
NZDUSD
Breakout
+12
rolling stdv
Multi-Timeframe Rolling Volatility Indicator - Smart Volatility Breakout System
Indicator
NAS100
NZDUSD
Breakout
+14
Matrix Pro by PrimeQuant
Multi-timeframe S/R, SRWMA trend & Demarker pivots with smart alerts—clarity for any market, any timeframe.
Indicator
NAS100
NZDUSD
Breakout
+11
Previous day Key Levels
Previous day key levels indicator
Fair Value Gap
FVG Detector: Identify and label Fair Value Gaps, with age, status & multi-timeframe support.
IR Candle MTF
with this indicator you could see other time frame candle in your chart.
Indicator
Breakout
ORB v1.1
Opening Range Breakout v1.1 - Visuals + Stats
LT_FairValueGap
Detects valid Fair Value Gaps from strong 3-bar patterns. Keep drawing unfilled gaps until price fills them.
Indicator
NAS100
NZDUSD
Breakout
+18
Breakout Channels by PrimeQuant
Detect institutional breakout zones with smart volume & channel analysis — by PrimeQuant.
Indicator
Grid
RSI
XAUUSD
+12
PFO Price Flow Oscillator
technical analysis tool designed to provide traders with a structured view of market momentum and volatility
Ichimoku Kinko Hyo
Ichimoku Kinkō Hyō with fixed shift to 25 as Ctrader calculate it from 0 and values was wrong for Chikou Span and Kumo.
Indicator
Indices
Breakout
Stocks
+2
VegaXLR - cTrader Pitchfork & Channel Enhancer
Enhance Pitchfork & Price Channels in cTrader with customizable Equidistant and Fibonacci levels.
Indicator
Indices
Prop
Breakout
+3
RVI
A precision-crafted indicator that compares current volume to its historical average for the same time of day.
Indicatore livelli numeri tondi_fabio23.traders
Indicatore dei livelli numeri tondi sul grafico , regolabile.Indicator of levels round numbers on the graph, adjustable