
Best ICT Trading Indicators for cTrader 2026
Compare ICT trading indicators for cTrader focused on smart money concepts and forex market structure. These tools help identify liquidity zones, order blocks, displacement, fair value gaps and potential entry areas for rule-based analysis.
Tools
Tool comparison
FAQ





















Tool comparison
Product | Reviews | Downloads | Sales | Price | Compatible platforms |
|---|---|---|---|---|---|
CRT Pattern Indicator | 4.6 (16) | 6.16K | — | Free | Windows, Mac |
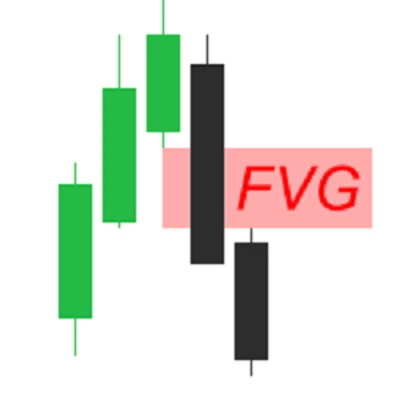
FVG_tidypips | 4.3 (3) | — | 13 | $19 | Windows, Mac |
Free Smart Money Concepts (SMC) from TradingView | 5.0 (12) | 4.19K | — | Free | Windows, Mac |
Institutional FVG Zones MTF with Confluence | 5.0 (3) | — | 10 | $25 | Windows, Mac |
Fair Value Gap Sessions | 5.0 (5) | 2.53K | — | Free | Windows, Mac |
FairValueGap-PremiumVersion1 | 4.5 (4) | — | 8 | $19 | Windows, Mac |
FairValueGap | 4.5 (2) | 2.42K | — | Free | Windows, Mac |
Liquidity & Structure (SMC) Pro | — | — | 5 | $29 | Windows, Mac |
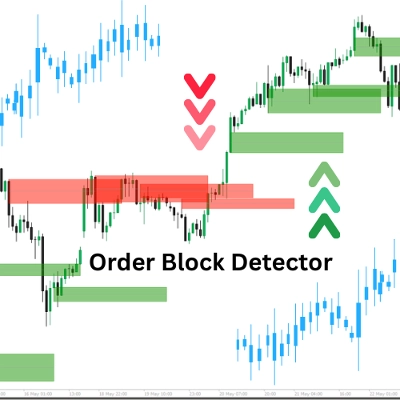
Order Block Finder | 5.0 (2) | 2.25K | — | Free | Windows, Mac |
Sessions + Killzones + ORB Pro | — | — | 4 | $29 | Windows, Mac |
AlphaTrend Pro by LudwigICT | 5.0 (6) | 1.35K | — | Free | Windows, Mac |
FOREX-SESSIONS-INDICATOR | 4.3 (3) | — | 4 | from $9 | Windows, Mac |
Fair Value Gaps | 5.0 (2) | 1.34K | — | Free | Windows, Mac |
SMC-ICT Control Panel | 4.3 (4) | — | 2 | from $19 | Windows, Mac |
Block Order Rreversal | 5.0 (1) | 1.23K | — | Free | Windows, Mac |
HAIQuantum_V5 | 4.0 (1) | — | 2 | $69 | Windows, Mac |
Market Sessions Advanced | 5.0 (1) | 1.16K | — | Free | Windows, Mac |
Daily Bias Estimator | — | — | 1 | from $19 | Windows, Mac |
Market Trend OB | 5.0 (1) | 989 | — | Free | Windows, Mac |
SMC_Structure_Gap_Monitor_Pro | — | — | — | $19 | Windows, Mac |
Fair Value Gap (Extended) | 5.0 (1) | 945 | — | Free | Windows, Mac |
SMC Suite 5in1 | 4.5 (2) | — | — | from $21 | Windows, Mac |
ICT Order Block | 3.5 (2) | 884 | — | Free | Windows, Mac |
SMC_Guardian_PRO_v2 | — | — | — | $67 | Windows, Mac |
Fair Value Gap FVG indicator | 4.5 (2) | 830 | — | Free | Windows, Mac |
ICT ALL IN ONE LEVELS | 4.7 (3) | — | — | $20 | Windows, Mac |
SMC Lite | 5.0 (1) | 751 | — | Free | Windows, Mac |
Bias_Ctrader | — | — | — | $30 | Windows, Mac |
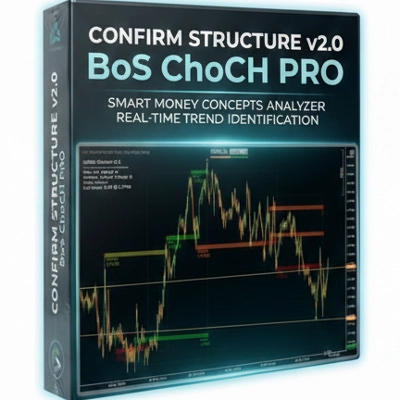
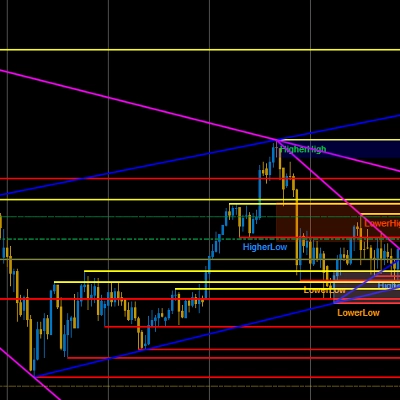
BOS CHOCH PRO 3.0 | 4.5 (2) | 745 | — | Free | Windows, Mac |
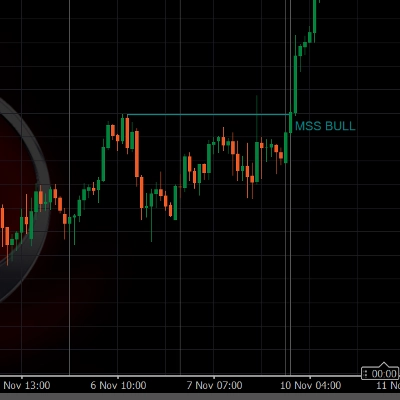
Free_ICT Breakers_BOS_MSS_withSourceCode | 5.0 (2) | 738 | — | Free | Windows, Mac |
ORB Range with FVGs | 1.0 (1) | 701 | — | Free | Windows, Mac |
[Stellar Strategies] BOS Trend 1.0 | 5.0 (1) | 495 | — | Free | Windows, Mac |
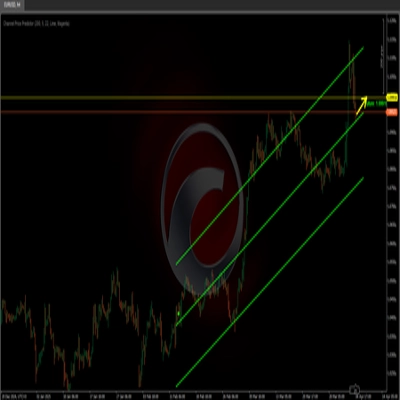
Channel Price Predictor | 5.0 (1) | 481 | — | Free | Windows, Mac |
WeTrade FVG | 3.0 (1) | 450 | — | Free | Windows, Mac |
WeSmCPro | — | 436 | — | Free | Windows, Mac |
SupportResistance | 5.0 (1) | 431 | — | Free | Windows, Mac |
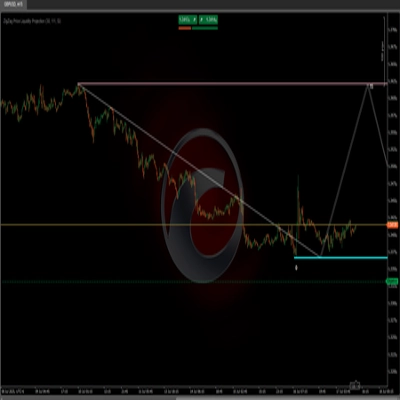
ZigZag Price Liquidity Projection | — | 424 | — | Free | Windows, Mac |
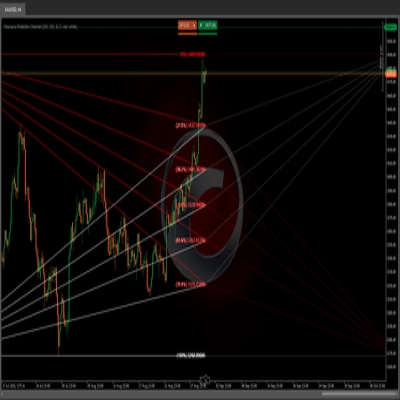
Fibonacci Prediction Channel | — | 347 | — | Free | Windows, Mac |
SMC_Guardian_Visual_Pro | 5.0 (1) | 298 | — | Free | Windows, Mac |
SMC | — | 283 | — | Free | Windows, Mac |
STVL Pro by Zofesu | — | 282 | — | Free | Windows, Mac |
Prediction Based on Linreg & ATR | — | 272 | — | Free | Windows, Mac |
Wejoy Institutional Sessions Elite | 5.0 (2) | 248 | — | Free | Windows, Mac |
ICT First Presented FVG | — | 241 | — | Free | Windows, Mac |
IVT Global Scanner | 5.0 (1) | 173 | — | Free | Windows, Mac |
Trader86-Fraktalline-Decoder- | 5.0 (1) | 169 | — | Free | Windows, Mac |
SMC_Structure_Gap_Monitor | 5.0 (1) | 150 | — | Free | Windows, Mac |
WEICTPRO | — | 125 | — | Free | Windows, Mac |
FAQ
An ICT indicator automates ideas from the Inner Circle Trader approach to price action, drawing them on the chart instead of by hand. Typical marks include order blocks, fair value gaps, liquidity resting beyond old highs and lows, displacement candles and market structure shifts.
ICT-style analysis is applied mostly to forex majors, gold and index CFDs such as NAS100 and US30. Traders often read bias on daily or H4 charts and time entries between M15 and M1 around the London and New York sessions, so check how an indicator handles time zones.
They can. A gap or order block is confirmed only after the candles that define it close, and some tools later delete or recolour zones once price trades through them, so history can look neater than it did live. Check the description for how confirmed and mitigated zones are handled.
No, it only draws zones and may alert you when price reaches one. If you decide to act, you place any order yourself and set protections such as a stop loss, which cTrader keeps on the server after your session ends; losses remain possible whatever the zone suggests.
Scroll back over several months of one symbol in cTrader's Windows or Mac app, noting how price behaved at each marked zone, including the ones that failed. Then follow the same tool on live bars, since zones drawn in real time can differ from those shown on history.