Indicator
Commodities
Stocks
Forex
Scalping
Support & Resistance Pro
"Support & Resistance Pro" logo
03/09/2025
36
Desktop
Since 22/11/2024
Traded volume
5.05M
Pips won
121.23K
Sales
68
Free installs
1906
"Support & Resistance Pro" uploaded image"Support & Resistance Pro" uploaded image"Support & Resistance Pro" uploaded image

Support & Resistance Pro

Overview

The Support & Resistance Pro is an advanced trading tool designed to empower traders with precise identification of critical support and resistance levels in the financial markets. Utilizing advanced algorithms and historical price data, this innovative indicator enhances your technical analysis, allowing you to make well-informed trading decisions.

Key Features

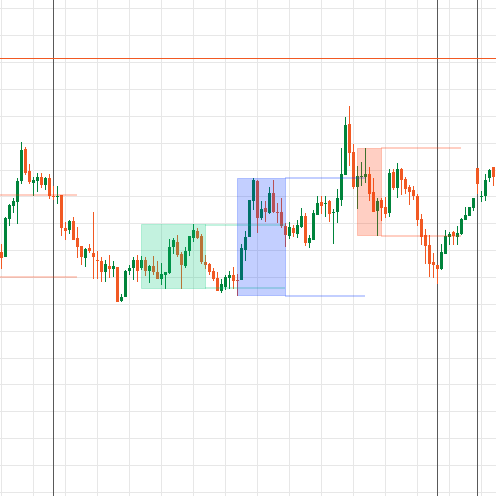
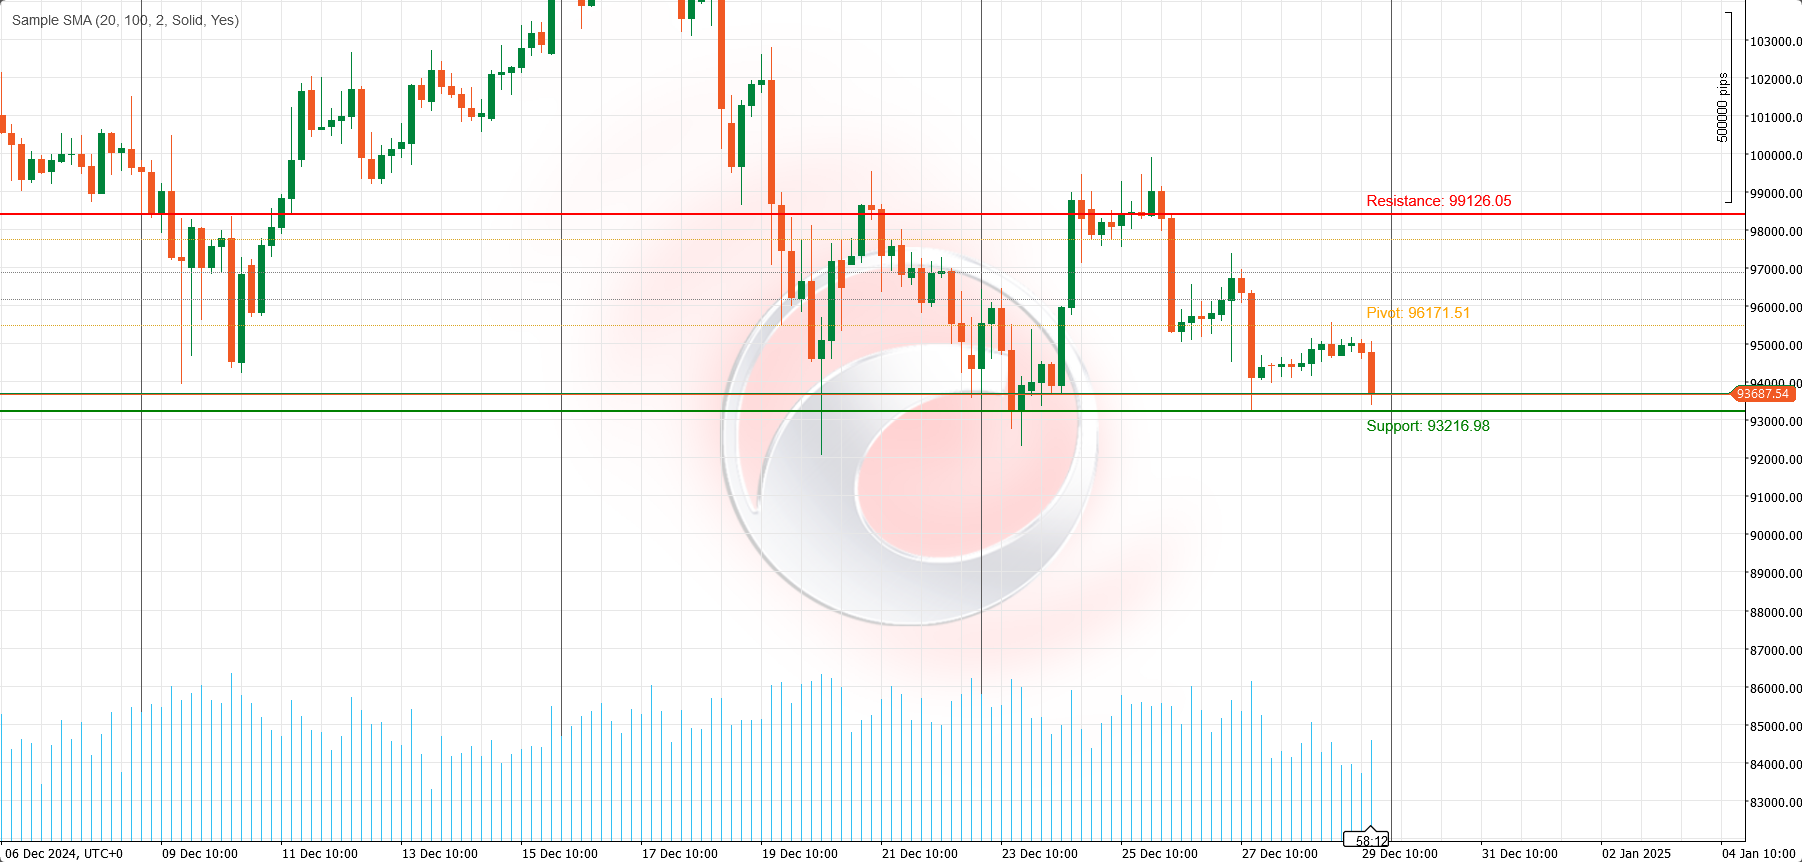
  1. Dynamic Support and Resistance Levels:
    • The indicator automatically calculates and displays both immediate and dynamic support and resistance levels. These levels adjust in real-time based on recent price action, providing essential reference points for potential price reversals.
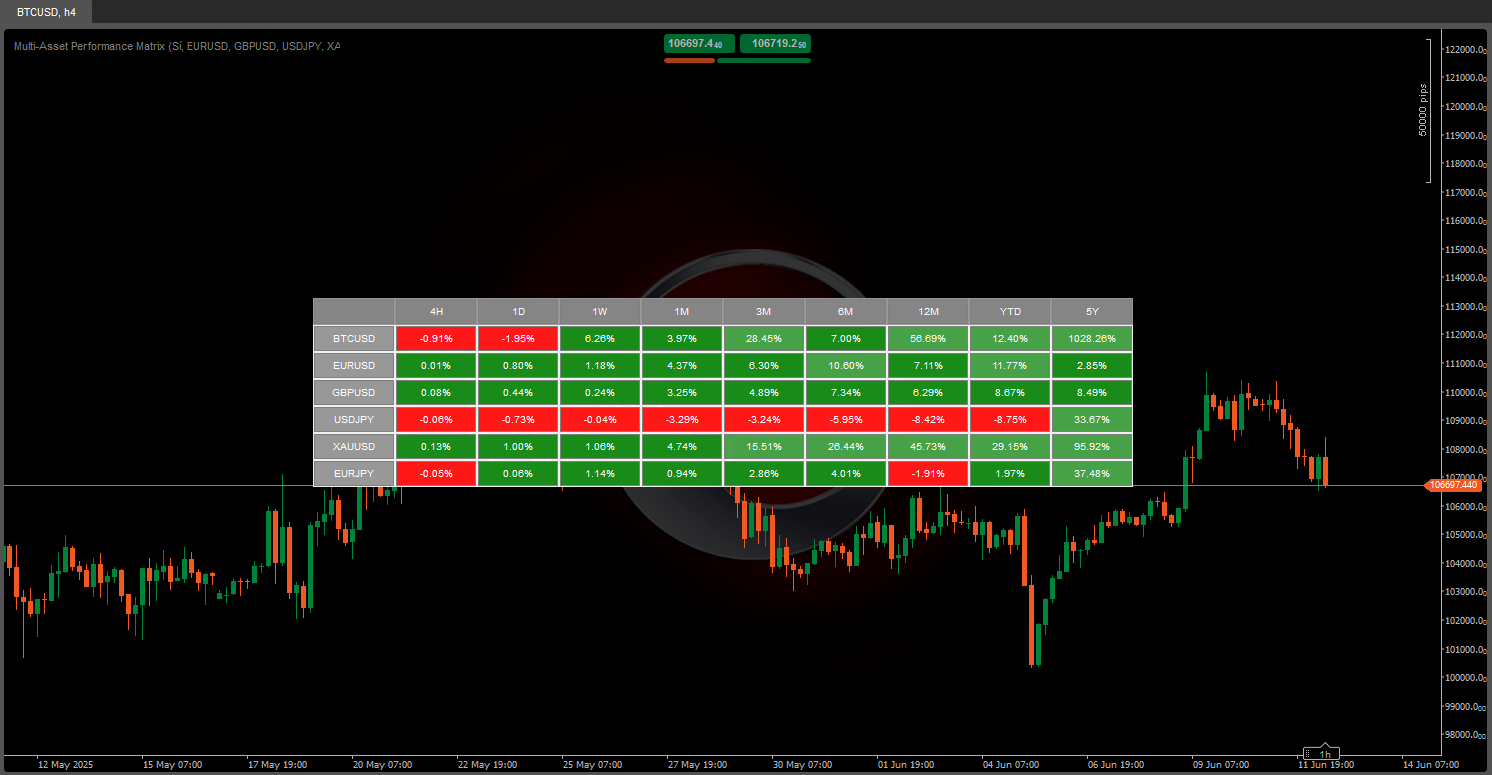
  2. Multi-Timeframe Analysis:
    • Support & Resistance Pro enables traders to view support and resistance levels across multiple timeframes, facilitating a comprehensive understanding of market structure and improving overall trading strategy.
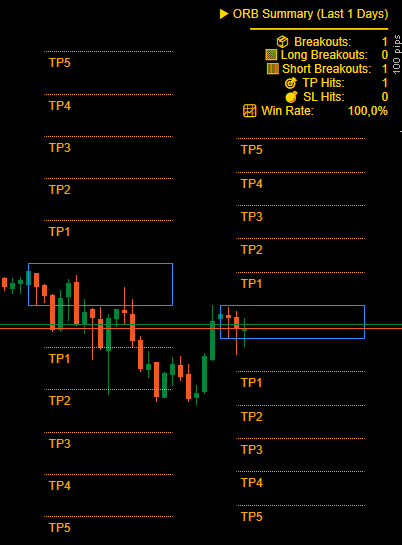
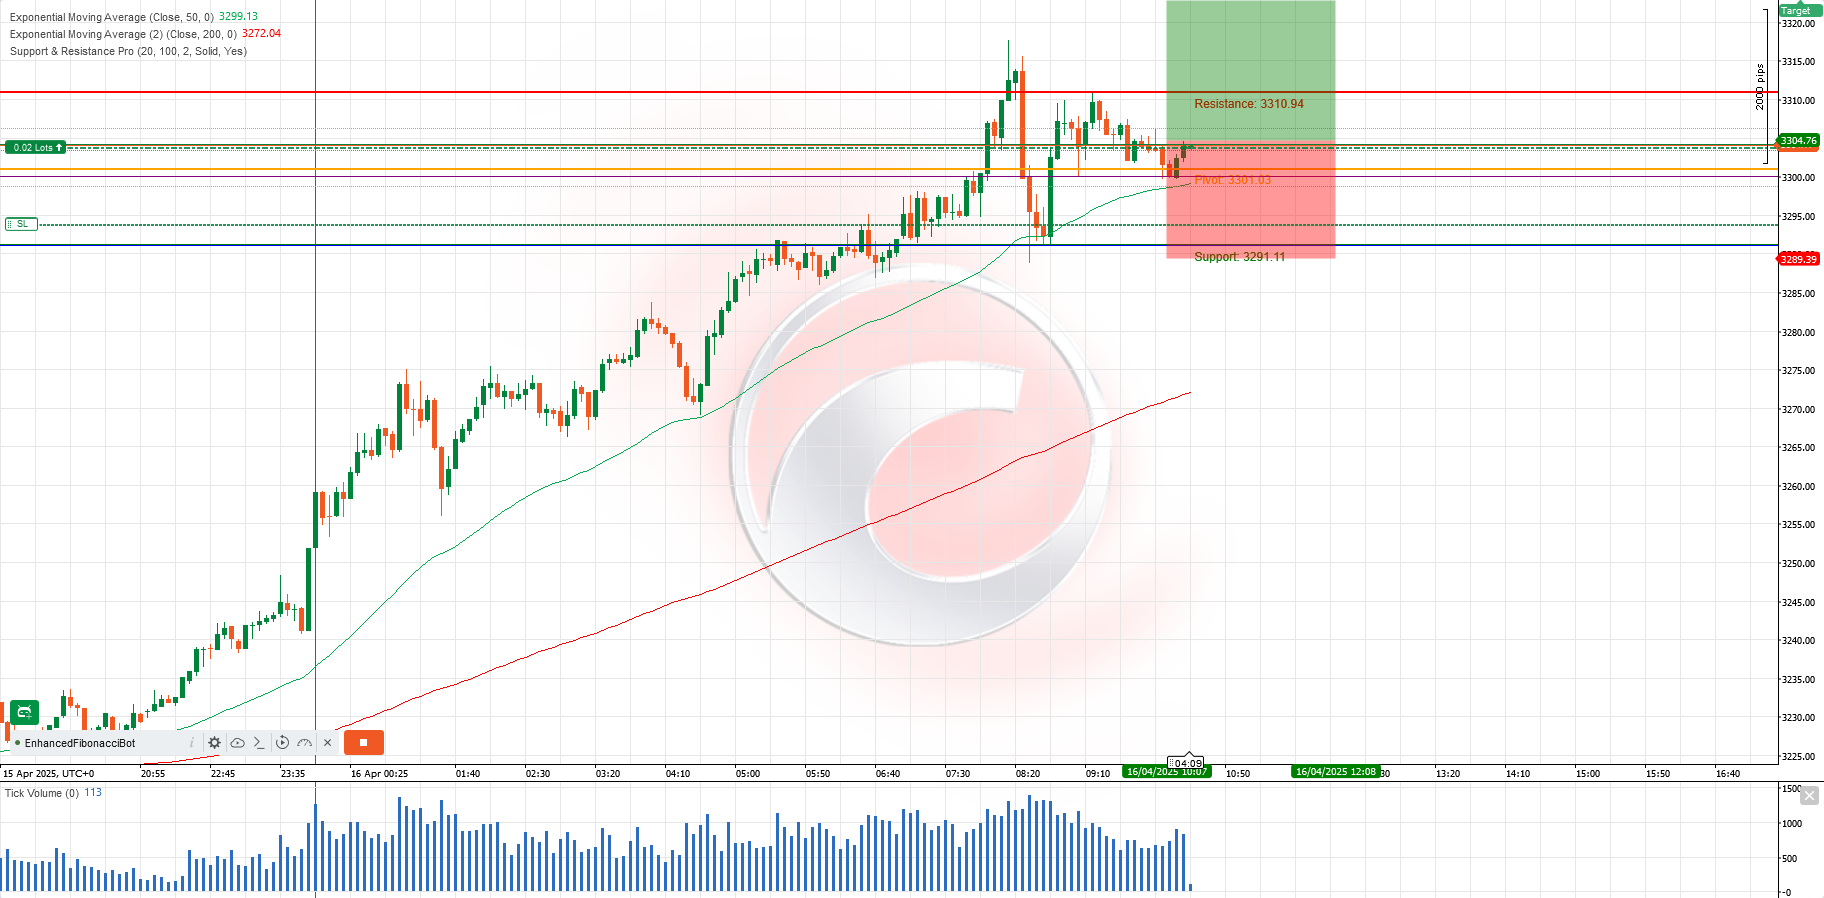
  3. Pivot Points Calculation:
    • Key pivot points are computed and visually presented, serving as critical markers for intraday trading. These pivots help traders identify potential reversal zones and establish target prices.
  4. Psychological Price Levels:
    • The indicator highlights psychological price levels, commonly referred to as "round numbers" (e.g., 1.2000 in Forex), where traders often place buy or sell orders. These levels are instrumental in gauging market sentiment.
  5. Fibonacci Retracement Levels Integration:
    • For those who utilize Fibonacci analysis, the Support & Resistance Pro feature allows you to enable Fibonacci retracement levels. This enhancement assists traders in identifying potential areas of support and resistance during price corrections.
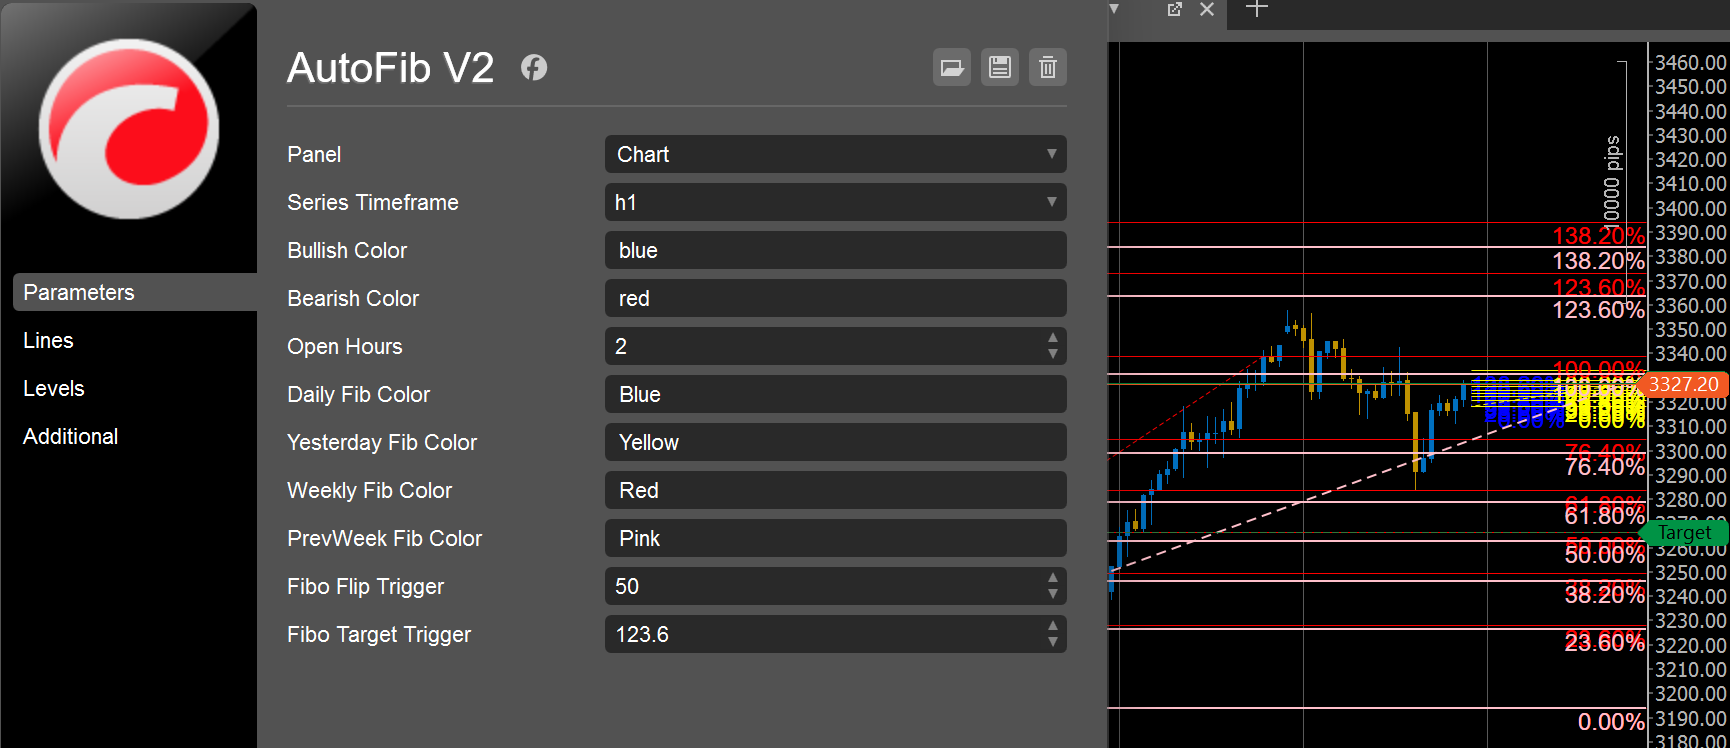
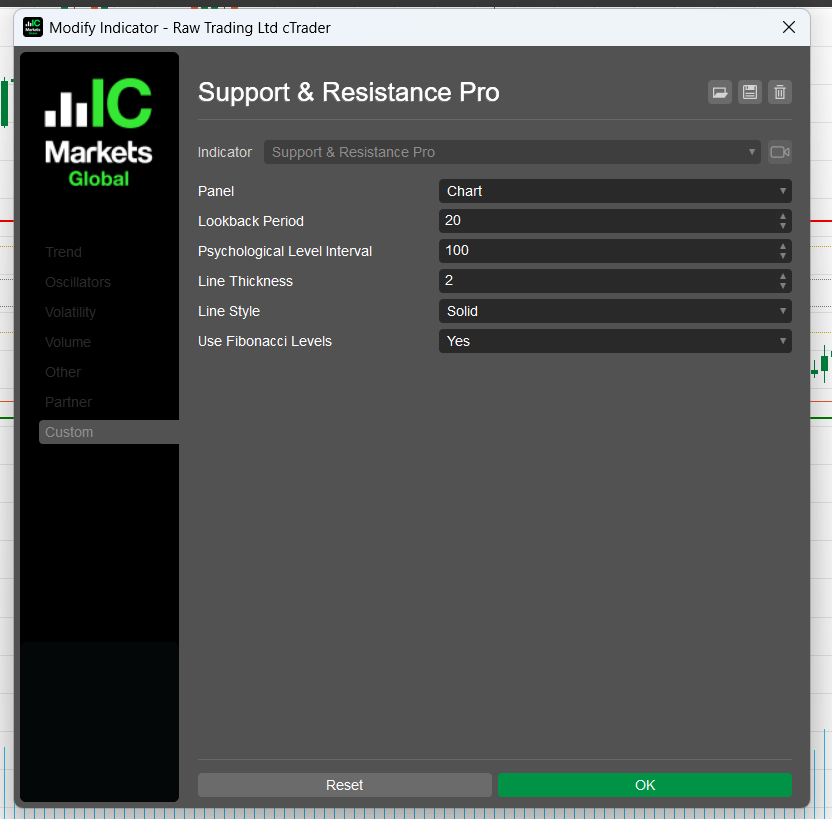
  6. Customizable Settings:
    • Traders can adjust numerous settings, including the lookback period, visualization styles, and color schemes, ensuring that the indicator aligns perfectly with individual trading preferences and styles.
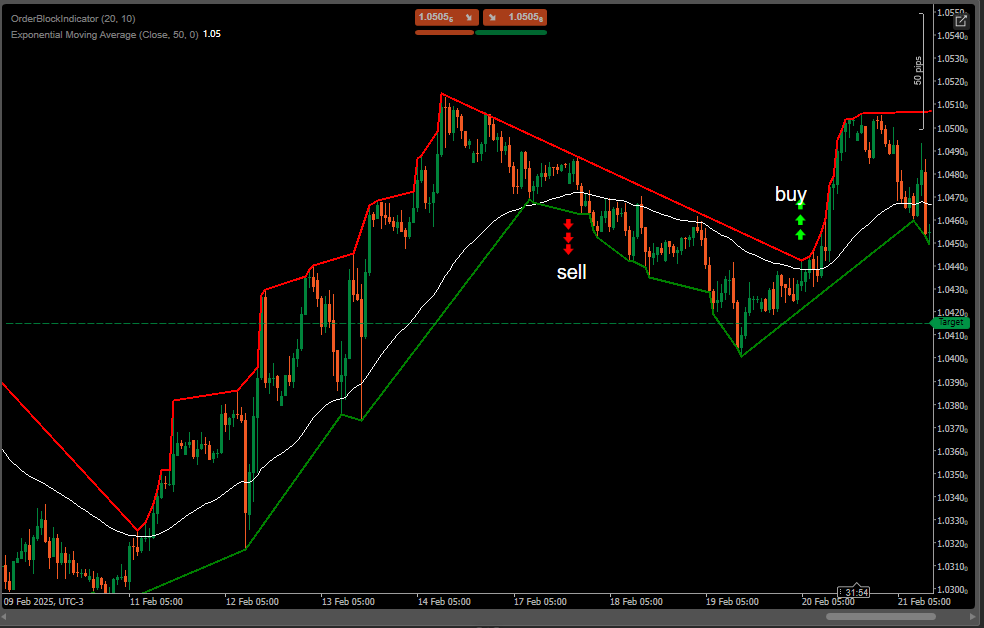
  7. Superior Visual Representation:
    • The clear and vibrant graphical representation of support and resistance levels on your charts enhances usability and readability, allowing for quick identification of market conditions.
  8. Real-Time Alerts:
    • The indicator can be configured to send alerts whenever the price approaches critical support or resistance levels, enabling traders to act swiftly and seize trading opportunities.

Benefits

  • Informed Trading Decisions: The comprehensive visualization of support and resistance levels aids in formulating stronger trading strategies, potentially increasing your win rate.
  • Market Awareness: Stay attuned to market movements and fluctuations, helping you to adapt your strategies according to the evolving market landscape.
  • Versatile Application: Beneficial for various trading styles—be it scalping, day trading, or swing trading—Support & Resistance Pro adapts seamlessly to your preferred methodology.

Ideal For:

  • Day traders, swing traders, and those investing in forex, commodities, or stocks seeking a structured approach to market analysis.
  • Both beginner and experienced traders looking to enhance their decision-making with reliable support and resistance data.

Conclusion

The Support & Resistance Pro indicator is an indispensable tool for traders striving to analyze market behavior effectively. By providing real-time insights into support and resistance dynamics, alongside pivot points and psychological levels, this indicator is designed to elevate your trading strategies and boost your confidence in the financial markets.

More from this author
Indicator
Indices
RSI
Stocks
+3
Advanced RSI Indicator
Advanced RSI Indicator with multi-MA smoothing, Bollinger Bands, divergence detection, and fill zones for cTrader.
Indicator
RSI
MACD
Multi-Timeframe Market Levels
Unlock market insights with our Multi-Timeframe Market Levels indicator, enhancing your trading strategies effortlessly
FibonacciStrategyCBot
FiboSmart cBot automates Fibonacci-based trading with trend, RSI, and MACD filters, plus built-in money management, trai
Indicator
ATR
Stocks
Commodities
+2
LevelMaster SR
LevelMaster S/R: Pinpoint key support & resistance zones with precision. Perfect for traders of all levels Trade smarter
Indicator
Indices
Stocks
Forex
+4
MACD Pro Trader
🚀 MACD Pro Trader – Advanced MACD with buy/sell signals, custom MAs & color-coded histograms for smarter trading! 📈🔥
Indicator
VWAP
Indices
RSI
+4
ProVWAP
Advanced Anchored VWAP for cTrader: volatility bands, real‑time alerts & customizable session resets.
Indicator
Signal
MACD
TradingViewMACD
Enhance your trading strategy with our customizable TradingViewMACD indicator. Optimize and elevate your market analysis
Indicator
RSI
EURUSD
MACD
Supply&Demand
Precision Supply & Demand zones indicator—automatically plots key buy/sell areas on your chart for smarter entries.
Indicator
Breakout
AutoLines™ Support & Resistance
FlexSR auto‑detects pivot highs/lows to plot dynamic support & resistance lines Features customizable styling and option
Indicator
RSI
Breakout
XAUUSD
+1
ZigzagSR
Automatic ZigZag swings with dynamic support & resistance levels, labeling highs/lows for clear trend signals.
SmartFibonacci
SmartFibonacci — automatic Fibonacci retracements & extensions with swing detection, alerts and clean labels for cTrader
Indicator
Breakout
Stocks
Commodities
+1
Advanced Donchian Zones
MTF Donchian: Identify trend breakouts & key zones with precision. Perfect for swing & day traders seeking accuracy!
Indicator
NAS100
NZDUSD
Martingale
+26
ICT Killzones
ICT Killzones plots Asian, London & New York trading sessions on your cTrader charts with clear zones & labels.
You may also like
Order Block Finder
Order Block Detector is built to spot and display Order Blocks on chart, often triggering strong price reactions.
Indicator
NAS100
NZDUSD
XAUUSD
+10
Moving Average PRO
Customize your Moving Average! Choose any timeframe and price source for precision and flexibility in your analysis.
Indicator
Breakout
Stocks
Signal
Darvas Box
The Darvas Box involves identifying "boxes" or trading ranges where a stock's price consolidates before breaking out.
Indicator
RSI
Indices
ATR
+3
Divergency 1.1_withSourceCode
🔍 Divergency Indicator for cTrader (Update v1.1)
Indicator
Bollinger
JMA
Jurik Moving Average (Jurik's Moving Average) triple adaptive filter with unique Jurik smoothing and dynamic factor.
Indicator
Indices
RSI
Stocks
+5
REDGREENZONEREVERSAL
The Red & Green Zone Reversal Indicator detects overbought and oversold market conditions using Bollinger Bands and RSI.
Indicator
RSI
Breakout
Supertrend
Market Trend OB
Price action to detect when the market changes trend (MSB) and defines, order blocks , ZigZag etc.📊
Indicator
Indices
Stocks
Forex
+4
MACD Pro Trader
🚀 MACD Pro Trader – Advanced MACD with buy/sell signals, custom MAs & color-coded histograms for smarter trading! 📈🔥
Trend Direction Force Index - TDFI (Alerts)
Spot Strong Trends Early & Filter Market Noise
Multi_TF Candlestick Chart Overlay
Perfect for traders who demand a clear overview of multiple timeframes at a glance.
Head Shoulders Finder
Detects Head & Shoulders patterns, plots signals, and alerts for trading opportunities.
Cumulative Delta Candles + VolumeProfile
Cumulative delta candles + volume profile
Goldenhours
The Session Golden Hours indicator is designed for serious traders looking to visualize high-probability
Indicator
RSI
Breakout
XAUUSD
+6
Multi-Asset Performance Matrix
Visual tool tracking financial assets' % performance across timeframes, highlighting trends with color-coded insights.
Indicator
Indices
Forex
session indicator
📈 Trading Sessions Indicator — London, New York & Tokyo Visualize Key Market Sessions + High/Low Levels with Precision
Indicator
Breakout
ORB v1.1
Opening Range Breakout v1.1 - Visuals + Stats
Block Order Rreversal
Order BlockIndicator reversal
CursorbyteAutoFib v2
Draw Fibonacci on the current day, previous day, current week, and previous week on all charts.