Description
📊 Jackson Zones — Adaptive Fibonacci Zone Mapping
Reveal the rhythm beneath price action. Jackson Zones maps intraday and multiday structure using Fibonacci-projected session ranges, adaptive labeling, and robust time logic. Designed for institutional-grade clarity, it’s your edge in volatile markets.
🔍 Key Features
- Customizable Fibonacci Multipliers
Define your own expansion ratios (default: 0.618, 1.000, 1.618) to tailor the zones to your strategy.
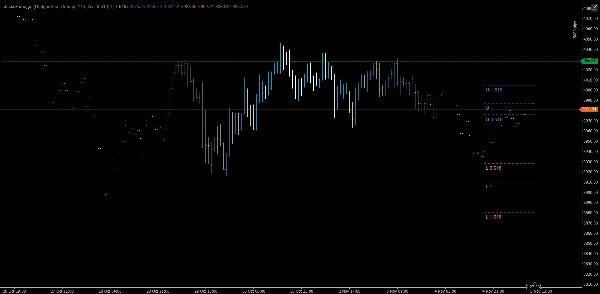
- Multiday Mode: Toggle to extend zones across multiple sessions, revealing persistent structure and long-range confluence.
- Weekend Logic
Automatically uses Friday’s data for both Sunday and Monday sessions, ensuring reliable levels even on brokers with Sunday bars.
- Visual Flexibility
- Adjustable upper/lower zone colors
- Opacity control (0–255) for transparent overlays
- Optional labels that dynamically reflect your chosen multipliers
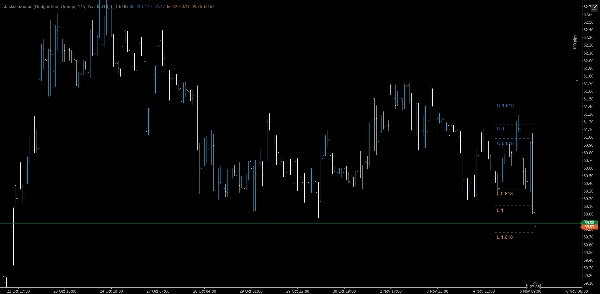
- Overlay Design
Zones and pivot are plotted directly on the price chart for immediate context.
🧠 Use Cases
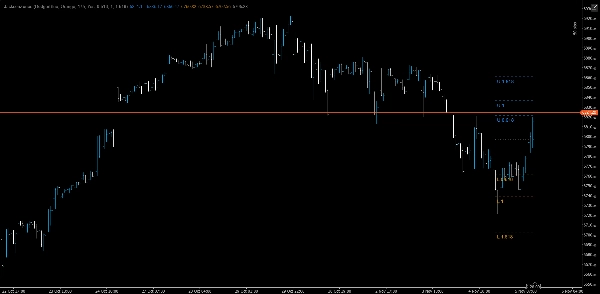
• Breakout Confirmation: Strong moves through the 1.000 or 1.618 zones often signal continuation.
• Reversal Detection: Failures at 0.618 or 1.000 zones highlight exhaustion.
• Trade Management: Use zones for stop placement, scaling, or profit targets.
• Session Anchoring: Zones reset daily, adapting to evolving volatility while respecting weekend gaps.
Summary
Customer reviews
5 | 0 % | |
4 | 100 % | |
3 | 0 % | |
2 | 0 % | |
1 | 0 % |


