"ADX advanced" logo
ADX advanced
"ADX advanced" uploaded image
17
Sales
479
Free installs
About trial version
TRIAL RESTRICTIONS - Only GBPUSD and EURUSD are allowed - Works for 1 hour from indicator load (session-based) - Rotating watermark message is displayed on chart

ADX Advanced Cloud & Momentum System

The standard Average Directional Index (ADX) is a powerful tool, but let's be honest: staring at three intersecting lines (+DI, -DI, and ADX) is messy, confusing, and strains your eyes.

The ADX Advanced Indicator completely modernizes this classic tool. It transforms the chaotic lines into a clear, visual powerhouse that tells you exactly WHO is in control (Bulls vs. Bears) and HOW STRONG the trend is, all at a single glance.

Key Features

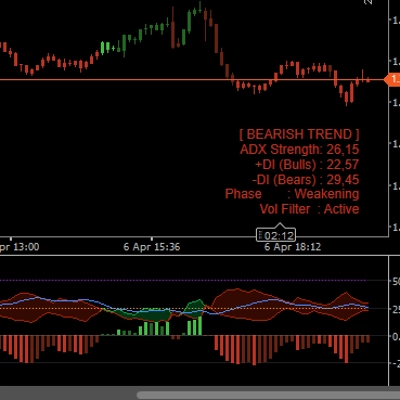
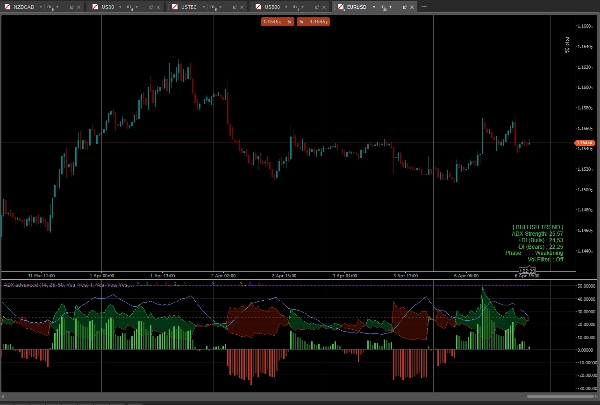
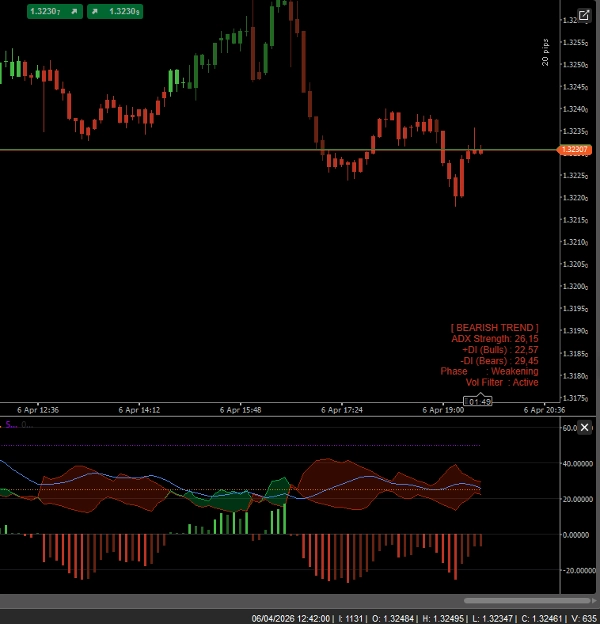
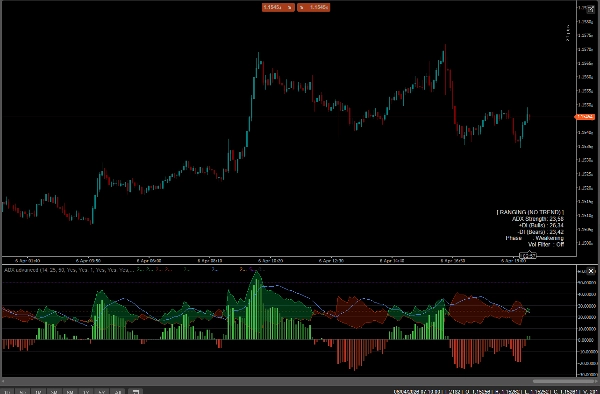
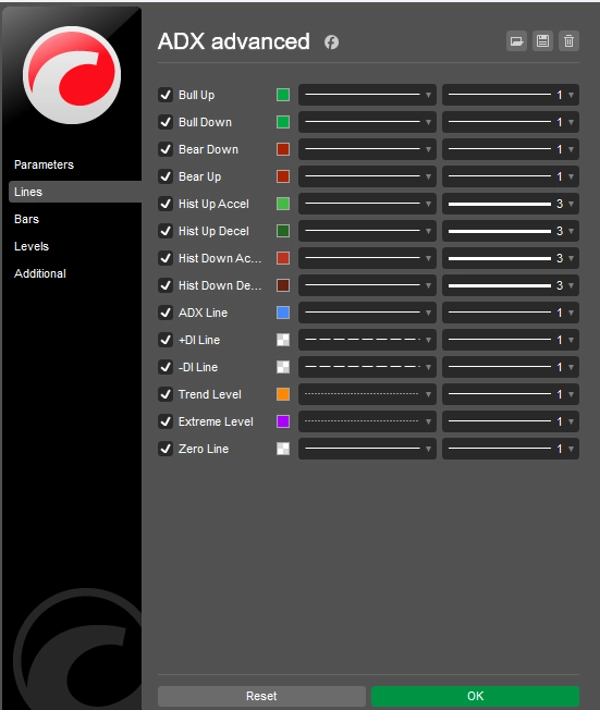
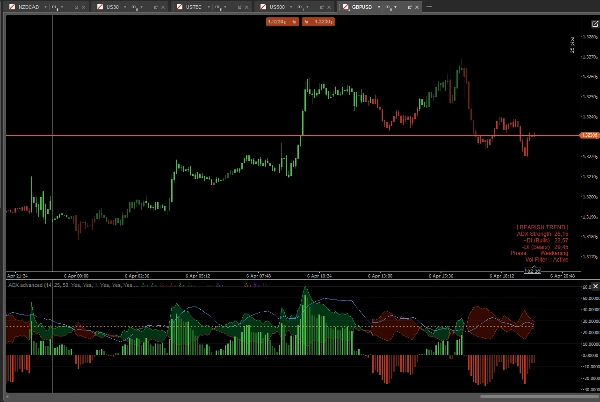
  • Directional Clouds (DI Cloud): Instead of crossing lines, the space between +DI and -DI is filled with a dynamic color cloud. Green Cloud = Bulls in control. Red Cloud = Bears in control.
  • Momentum Histogram: A custom-built histogram at the bottom of the indicator measures the exact distance between +DI and -DI. It features acceleration/deceleration colors, allowing you to spot fading momentum before the trend actually reverses.
  • Smart Bar Coloring (Paintbars): The indicator directly paints your price candles based on trend strength!
    • Bright Green/Red: Strong Trend (ADX > 25 & +DI/-DI alignment)
    • Dark Green/Red: Weak Trend / Ranging (ADX < 25)
    • Purple/Magenta: Extreme Overextended Trend (ADX > 50) - Get ready for a pullback!
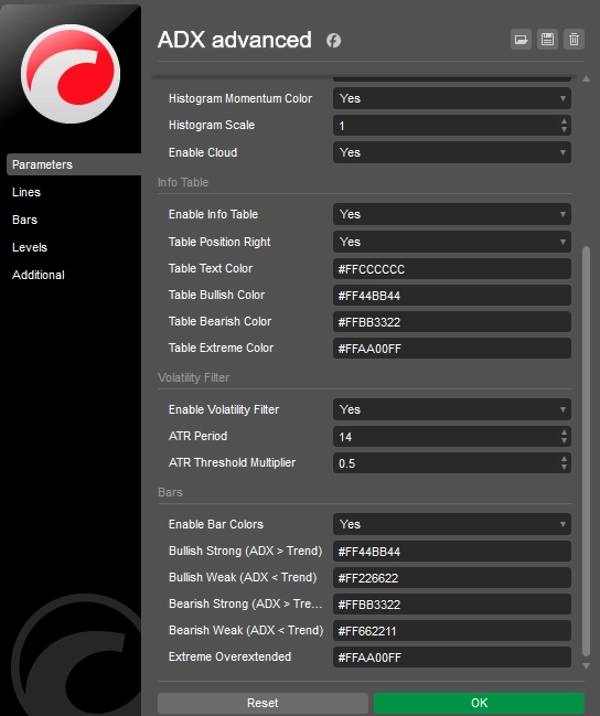
  • On-Chart Info Panel: A sleek, non-intrusive dashboard displays the current Market State (Trending, Ranging, Extreme), ADX Strength, and Momentum Phase in real-time.
  • Built-in Volatility Filter (ATR): Optional ATR filter that grays out candles and histogram bars when the market goes completely flat, saving you from trading in chop.
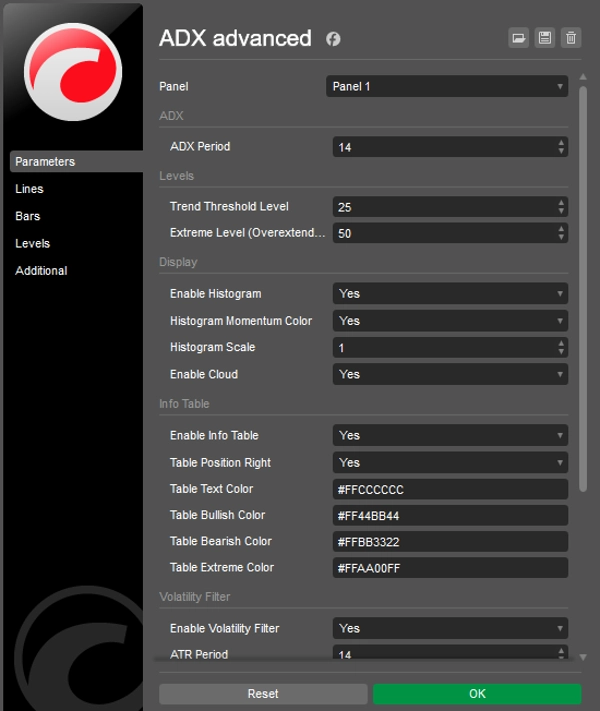
  • Fully Customizable: Change colors, thresholds (Trend level 25, Extreme level 50), and histogram scaling to fit your personal trading style and chart theme.

How to use it?

  1. Wait for the ADX blue line to cross above the 25 Threshold (Trend is active).
  2. Look at the Cloud and Histogram to confirm direction (Green for Long, Red for Short).
  3. Trade the breakouts and ride the trend while candles are painted in "Strong" colors.
  4. Take profits or trail stops when the ADX line crosses the 50 Extreme Level (candles turn purple).
About trial version
TRIAL RESTRICTIONS - Only GBPUSD and EURUSD are allowed - Works for 1 hour from indicator load (session-based) - Rotating watermark message is displayed on chart
Indicator profile
0.0
Reviews: 0
Customer reviews
No reviews for this product yet. Already tried it? Be the first to tell others!
BTCUSD
Forex
Signal
Indices
EURUSD
Commodities
GBPUSD
NZDUSD
Prop
XAUUSD
NAS100
ATR
USDJPY
Products available through cTrader Store, including trading bots, indicators and plugins, are provided by third-party developers and made available for informational and technical access purposes only. cTrader Store is not a broker and does not provide investment advice, personal recommendations or any guarantee of future performance.

More from this author

The EMA Trend Simple is a trend-following tool designed for simplicity and visual clarity.
MACD Advanced -- It combines the standard MACD logic with a rich set of visual tools
Follow The Trend cBot - INDICATOR - displays two Moving Average Bands for cBot or for your own use
EMA Clouds, Multi-Timeframe (MTF) Overlay, Swing High/Low detection, and a smart Dashboard with neutral zone filtering.
HCCC MTF (Hurst Cycle Composite Channel), Designed for Semi-Automated Trading, Interactive MTF Dashboard
"HLC_Levels" logo
$ 20
/
$25
The ultimate tool for Price Action and ICT. High, Low and Mid levels for days, weeks Inc. NY Midnight and Custom Range.
Weekly Daily Opening Gaps — NWOG & NDOG Indicator Professional-grade opening gap visualization for institutional traders
EMA MTF TREND PRO - Multi-timeframe trend analysis overlay indicator, 6 timeframes - in one table with ADX
Sessions PRO is a professional session visualization indicator - 4 Fully Customizable Sessions
The standard Relative Strength Index (RSI), RSI & Signal Cloud, Smart Volatility Filter (ATR), On-Chart Info Dashboard
FOLLOW THE TREND XAU EDITION v2.0, Start with $1,000, AI features BE & TP50%, Improved security and performance,
7.9%
5.78
Profit factor
5.36%
Max drawdown
Bollinger Bands Advanced Squeeze & Breakout System, Real-Time On-Chart Dashboard, Auto-Squeeze Detector, Dual-Band Cloud

You may also like

The **Whale Hunting Indicator** is a trading tool for **Boom & Crash and Volatility indices**, featuring **Auto Trend De
Dynamic Trend Flux is a colored momentum oscillator based on the classic fast/slow EMA difference plus a signal line.
AI-powered KNN machine learning indicator for cTrader. Features dynamic ATR targets, trend filters & Telegram alerts.
Auto-detect support and resistance & trendlines, highlight pullbacks/BOS retests, and filter with candle confirmation.
UT Bot Alerts Nova: Advanced trend-following indicator using ATR for signals. Precise entries/exits.
CaptraTimeMarker: Marks key trading hours with lines & labels, plus daily separators for cTrader. Customizable & precise
Analyzes price and delta volume across periods, projecting future trends with visual tools and detailed data🚀📈
Future-AI indicator.
Connects each moving average value from candle to candle, forming a fan-like structure of trendlines.
Enhance the trading experience with real-time Spread, Time To Close, rPNL, uPNL, PNL and minimalistic Bid / Ask lines
Heatmap of intra-HTF volume (POC/VA) built from LTF tick data; paints current candle and auto-loads visible history.
Comprehensive time session indicator
Phoenix Zones - Detector de Reversiones Críticas
ATR Advanced Volatility & Trend System, Momentum Histogram, Extreme Volatility Detection, Volatility Expansion Clouds
⏱ Candle Time Remaining – Real-Time Candle Countdown Indicator
Market Cipher B
Engulfing Pattern Indicator
Detects Head & Shoulders patterns, plots signals, and alerts for trading opportunities.
17
Sales
479
Free installs