说明
▁▂▃▄▅▆▇ █ 10,000+ 交易者(机构 + 零售) █ ▇▆▅▄▃▂▁
- 选择我们在 cTrader 中的顶级指标 🏆
- ✨ 独家精准,带来卓越成果 ✨
- 📈 我们的算法 — 拥有最高评价的视觉效果 🎯—
- 已成功应用于两个量化基金
▁▂▃▄▅▆▇ █████████████████████████████ ▇▆▅▄▃▂▁
_______________________________________________
_______________________________________________
📌 市场结构指标
· ✅ 高级市场结构:Bos、Choch、SwinLevels、订单区块、 市场结构& 流动性发现器
⚖️ 高级折扣区
🧠 ICT 宏观理论
· 🔄 动态市场结构转折点分析
· 🧱 订单区块
· ⚖️ 市场失衡
· ⛓️ BOS & CHOCH
· 🧠 ICT 三力
· 🌀 市场极性区
______________________________________________________________-
商店 cBots : 🧠 黄金 & BTC 突破交易时段枢轴 🧠
_______________________________________________
🔚 智能退出系统
· 📍 跟踪智能算法
_______________________________________________
📐 之字形指标
· 🔍 之字形价格流动性投影
· 🧭 支撑与阻力结构之字形
· ➖ 之字形
· 🎯 之字形极限追踪器
_______________________________________________
🧱 支撑与阻力指标
· 🟩 智能趋势支撑与阻力线
· 🧱 所有支撑和阻力水平
_______________________________________________
📊 趋势与通道指标
· 🔄 自动趋势通道
· 📊 超级趋势
· ⚡动量趋势分析器
· 🧠 自适应趋势通道
· 💥 通道突破系统
· 🌈 动态趋势渐变
· ⭐ 高级 SSL 通道
· 🔁 反应性移动平均线
_______________________________________________
💧 成交量与流动性工具
· 🔥 成交量 POC 热力图
· 📉 杠杆清算图
· 🔍 动量公允价值缺口
· 🕒 公允价值缺口时段
_______________________________________________
⚡ 动量与 RSI 指标
· 📈 RSI 趋势触发器
· 🚀 动态范围动量
· 🔎 多层蜡烛偏向追踪器
_______________________________________________
🔮 预测与投影工具
· 📐 基于线性回归和 ATR 的预测
· 📏 斐波那契线性回归多时间框架
· 📈 成交量驱动的市场流动投影器
📉 斐波那契扇形
______________________________________________________________________________________________________
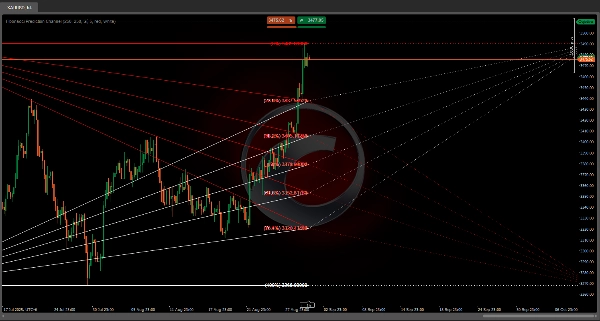
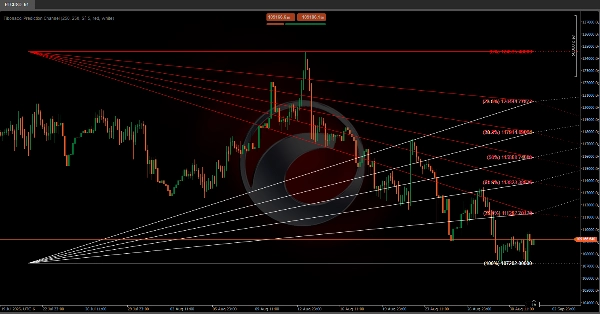
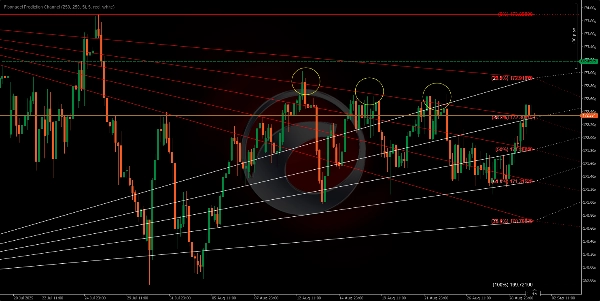
该算法旨在基于 斐波那契 回撤水平绘制未来预测通道 📊✨。斐波那契线在每对连续水平之间创建一系列平行通道。这些通道可以解释为价格预计波动的范围 📈📉,生成一个 视觉锥体 价格将在其中互动 🎯。如果某个水平被突破 ⚡,我们将转向下一个水平。
这些投射到未来的水平也充当 支撑和阻力 🛡️⚔️,在图表上创建视觉通道,帮助我们基于价格过去对这些水平的反应来预测和规划行动 🧠✅。
我们可以预期价格在接近这些线时会有反应 🔍,可能会 反弹 回到通道内 🔄,或者如果有足够的 动量 🚀,突破这些线进入下一个通道。
向右投射的水平 ➡️🗓️ 并非基于新的价格数据,而是基于 过去的价格行为 ⏳。它们作为一种 “地图” 🗺️,指示潜在的未来价格反应。
历史柱线 ⏰:确定在计算斐波那契回撤水平时将考虑多少过去的价格周期。