Description
🚀 Plus de 10 000 traders utilisent déjà nos MEILLEURS indicateurs🏆
Découvrez pourquoi les professionnels nous choisissent – les outils les plus puissants sur cTrader (indicateurs, algorithmes et cBots) vous attendent.
👉 Obtenez tous nos systèmes TOP ici :
_______________________________________________
📌 Indicateurs de Structure de Marché
· ✅ AdvancedMarket Structure : Bos, Choch, SwinLevels, Order Blocks, Market Structure& Liquidity Finder
· 🔄 Analyse Dynamique de la Structure du Marché des Points de Renversement
· 🧱 Order Block
· ⛓️ BOS & CHOCH
· 🧠 ICT Power of 3
· 🌀 Zones de Polarité du Marché
_______________________________________________
🔚 Systèmes de Sortie Intelligents
· 📍 Algorithme Intelligent de Trailing
_______________________________________________
📐 Indicateurs ZigZag
· 🔍 Projection de Liquidité des Prix ZigZag
· ➖ ZigZag
· 🎯 Suivi des Extrémités Zig-Zag
_______________________________________________
🧱 Indicateurs de Support & Résistance
· 🟩 Lignes de Support & Résistance SmartTrend
· 🧱 Tous les Niveaux de Support et Résistance
_______________________________________________
📊 Indicateurs de Tendance & Canal
· 🔄 Canal de Tendance Automatique
· 📊 Supertrend
· ⚡Analyseur de Tendance Momentum
· 🧠 Canal de Tendance Adaptatif
· 💥 Système de Rupture de Canal
· 🌈 Gradient de Tendance Dynamique
_______________________________________________
💧 Outils de Volume & Liquidité
· 🔥 Carte Thermique Volume POC
· 📉 Carte de Liquidation à Effet de Levier
· 🕒 Sessions de Fair Value Gap
_______________________________________________
⚡ Indicateurs Momentum & RSI
· 📈 Déclencheur de Tendance RSI
· 🚀 Momentum de Plage Dynamique
· 🔎 Biais de Chandelle Multi-Niveaux
Suivi
_______________________________________________
🔮 Outils de Prédiction & Projection
· 📐 Prédiction Basée sur Linreg & ATR
· 📏 Régression Linéaire Fibonacci Multi-échelles
· 📈 Projecteur de Flux de Marché Alimenté par le Volume
________________________________________________________________________________________________________
________________________________________________________________________________________________________
Courbe de Bézier du Modèle McDonalds 🍟
À quoi ça sert ? 🤔
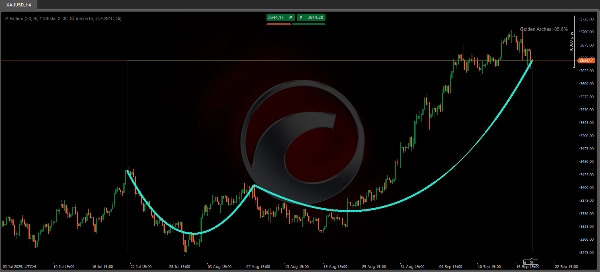
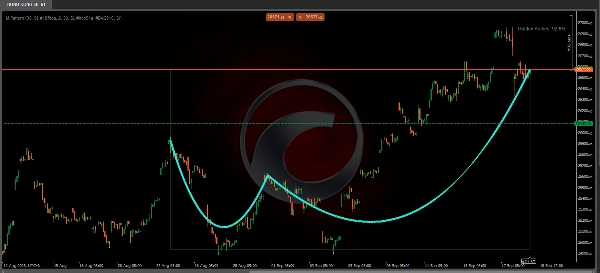
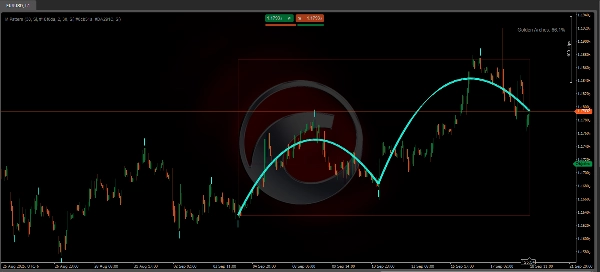
L’indicateur "Courbe de Bézier du Modèle McDonalds" est conçu pour identifier et visualiser les motifs de retournement de prix à l’aide de courbes de Bézier. Son objectif principal est de détecter des structures de marché ressemblant à des arcs (similaires à un "M" ou "W") sur les graphiques, ce qui pourrait indiquer des changements potentiels de tendance 🎯. De plus, il inclut un système de notation pour évaluer la qualité du motif détecté.
Comment ça fonctionne ? ⚙️
- Détection des Pivots :
L’indicateur analyse une période de retour en arrière (définie par "Lookback Period") pour identifier les hauts et bas locaux (pivots). Ceux-ci sont marqués par des cercles sur le graphique : ⚪ - Courbes de Bézier :
Une fois qu’au moins 5 pivots sont détectés, l’indicateur trace deux arcs à l’aide de courbes de Bézier qui relient ces points. Ces arcs visent à lisser la transition entre les pivots pour former une structure visuelle similaire à deux arches jumelles ("Arches Dorées") 🏛️. - Zone Colorée :
Si activée, une zone est dessinée entre le premier et le dernier pivot. La couleur de cette zone dépend de la direction du motif : -
- 🟢 Vert : Tendance haussière (si le dernier pivot est plus haut).
- 🔴 Rouge : Tendance baissière (si le dernier pivot est plus bas).
- Score du Motif :
Il calcule un pourcentage reflétant la symétrie et la qualité des arcs. Un score plus élevé suggère un motif mieux défini.
Est-ce qu’il repeint (retrace) ? 🔄
Oui, cet indicateur repeint. Cela signifie que ses tracés et détections peuvent changer rétroactivement à mesure que de nouvelles données de prix sont obtenues. Cela s’explique par le fait que l’identification de ces points d’inflexion est basée sur l’observation d’un certain nombre de barres après la formation du pivot potentiel. Par conséquent, ce qui semble être un arc confirmé dans les données historiques peut être ajusté ou disparaître lorsqu’il est appliqué aux graphiques en temps réel 📊.
Il peut être utilisé comme aide complémentaire en analyse technique.
Comment pourrait-il être utilisé ? 💡
- 📚 Analyse de Backtesting :
Utile pour étudier les motifs historiques et évaluer leur efficacité sur différents actifs ou périodes. - 👁️ Confirmation Visuelle :
Peut compléter d’autres outils d’analyse (comme le support/résistance ou les moyennes mobiles) pour valider les retournements potentiels. - 🎓 Éducation :
Aide à reconnaître les structures de marché basées sur les courbes de Bézier, bien que son utilisation en trading en direct nécessite une vérification supplémentaire.
Limitations et Recommandations ⚠️
- Utilisation en Temps Réel :
Puisqu’il repeint, il ne doit pas être utilisé comme signal indépendant pour les entrées ou sorties de marché. - Optimisation :
Ajustez la "Lookback Period" selon l’actif et la période pour réduire les faux signaux. - Contexte du Marché :
Fonctionne mieux dans les marchés en tendance et non dans les marchés latéraux ou en range.
Note Importante : 🚨
Étant donné sa dépendance aux données futures pour confirmation, il doit être utilisé principalement pour analyser des événements déjà survenus, tels que les baisses post-ouverture de marché ou les exercices éducatifs sur graphique, plutôt que pour des fins prédictives ou de trading en direct. Bien que son approche soit innovante, il doit être utilisé en complément d’autres indicateurs et analyses pour éviter les faux signaux dus à sa nature de repeint. Il est idéal pour les études de backtesting ou comme complément éducatif dans les stratégies de trading.
Résumé
This tool repaints, meaning its visualizations and detections can change retroactively as new price data arrives, so it is best used for backtesting, educational purposes, or as a complementary aid alongside other technical analysis tools. It is optimized for trending markets and requires adjustment of the lookback period to suit different assets and timeframes. The indicator supports markets including Forex (e.g., EURUSD), commodities (e.g., XAUUSD), and cryptocurrencies (e.g., BTCUSD).