
ZScore Reversion
指标
326 下载
版本 1.0, May 2025
Windows 版、Mac 版
5.0
评价:1
说明
Pinescriptlabs 商店指标: 🤖Pinescriptlabs 商店 cBots :(cBot)
黄金 & BTC 突破会话枢轴(新)
Z 分数 将价格转换为“标准
偏差”尺度,
显示每根蜡烛的收盘价(或开盘价、最高价、最低价)偏离其
历史均值的程度。通过直观的视觉效果,它有助于识别超买/超卖
条件 和
高概率反转区域!🔄
1️⃣ 它的作用是什么?
🔹 标准化价格:将绝对收盘值转换为一个Z 分数——即它距离过去
N 根柱子的均值有多少个标准偏差。
🔹 突出显示
统计极值:接近
±1、±2 或 ±3 的值表示价格变动的罕见性:
- ±1 标准差 (≈ 68% 的概率在 –1 和 1 之间)
- ±2 标准差 (≈ 95% 的概率在 –2 和 2 之间)
- ±3 标准差 (≈ 99.7% 的概率在 –3 和 3 之间)
🔹 辅助
均值回归交易:
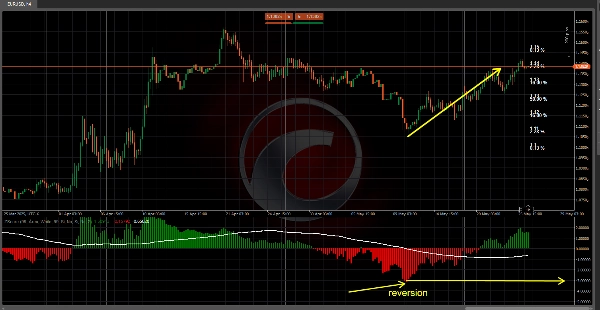
当 Z 分数超过±2 或 ±3时,市场处于极端
区域,并倾向于
回归均值(零)。
🔹 清晰的
可视化:使用直方图(或特殊蜡烛)、移动平均线和彩色区域,您可以立即看到价格是
“正常”还是统计
异常值。
2️⃣ 它是如何工作的?
📐 均值和标准偏差的计算
- 使用一个
回溯期(例如,99
根柱子)。 - 计算均值和
标准偏差(SD)的收盘价。 - 标准偏差越大,价格波动越大。
🧮 Z 分数公式
Z=当前收盘价−历史均值标准偏差Z=标准偏差当前收盘价−历史均值
- 正 Z→ 收盘价高于均值。
- 负 Z→ 收盘价低于均值。
📊 Z 表概率
- 突出显示当前 Z 分数所在列,显示价格的罕见/极端程度!
3️⃣ 如何在交易中使用
✅ 均值回归:寻找Z > +2 或 Z < –2进行反转交易(卖出超买极端,买入超卖极端)。
✅ 趋势确认:持续的Z > 0 + 上升的移动平均线表示强势;
Z < 0 + 下降的移动平均线表示弱势。
✅ 风险管理:接近±1 标准差时,预期正常波动;接近
±3 标准差时,需谨慎调整止损和仓位大小。
✅ 入场时机:将极端 Z 分数与支撑/阻力
水平结合,实现精准入场。
4️⃣ 优点与注意事项
✔️ 优点
- 统计优势,能识别极端价格状况。
- 多种显示模式(直方图、蜡烛图、波段、概率表)。
- 易于定制(长度、颜色、图表类型)。
⚠️ 注意事项:
- 在强劲的
趋势中,价格可能长时间保持“极端”状态而不反转。 - 假设价格呈
正态分布,在高度波动/偏斜的市场中可能效果不佳。 - 最佳应用于
波动性稳定的环境。
摘要
AI 摘要
ZScore Reversion is a trading indicator that standardizes price data by converting closing prices into Z-Scores, which measure how many standard deviations a price is from its historical mean over a specified lookback period. This transformation highlights statistical extremes near ±1, ±2, or ±3 standard deviations, indicating overbought or oversold conditions and potential high-probability reversal zones.
The indicator calculates the mean and standard deviation of recent closing prices to determine the Z-Score using the formula:
Z = (Current Close − Historical Mean) / Standard Deviation.
Positive Z-Scores indicate prices above the mean, while negative scores indicate prices below it.
ZScore Reversion provides clear visualizations through histograms, special candles, moving averages, and colored zones to distinguish normal price behavior from statistical outliers. It supports mean reversion trading by signaling when prices exceed ±2 or ±3 standard deviations, suggesting a likely return to the mean. It also aids trend confirmation by interpreting sustained positive or negative Z-Scores combined with moving average trends.
Risk management is facilitated by adjusting stops and position sizes near extreme Z-Score values. Entry timing can be refined by combining extreme Z-Scores with support and resistance levels. The indicator offers multiple display modes and customization options for length, colors, and chart types. It is best suited for stable volatility environments and assumes a normal distribution of price data.
指标配置
客户评价
5.0
评价:1
5 | 100 % | |
4 | 0 % | |
3 | 0 % | |
2 | 0 % | |
1 | 0 % |
客户评价
May 27, 2025
Good implementation of Z Scores. I found that Z Scores work best when using MTF analysis to show counter trend scalps but I am sure those who trade moving average plays will find this very useful!
讨论
常见问答
BTCUSD
Breakout
Supertrend
Commodities
RSI
Crypto
XAUUSD
cTrader Store 提供的所有产品,包括交易机器人、指标和插件,均由第三方开发者提供,仅供信息参考和技术访问之用。cTrader Store 并非经纪商,不提供投资建议、个人推荐或任何未来业绩保证。


猜您喜欢


!["[Stellar Strategies] Inside Bar with Signals" 标识](https://cdn.ctrader.com/image/webp/1d9e8bfa-3b2c-4440-bb37-5856902008a7_30683)


价格
注册日期 03/10/2024
163
销售
39.25K
免费安装