Descrição
Indicadores da Pinescriptlabs Store: 🤖Pinescriptlabs Store cBots:
Linhas de Suporte e Resistência SmartTrend Pivôs de Sessão de Breakout de Ouro e BTC(novo) YieldShield" 🛡️
Estrutura Dinâmica de Mercado
Análise de Pontos de Virada
Fibonacci Linear
Regressão Multi-temporal
Gradiente de Tendência Dinâmico
Viés de Vela Multi-Nível
Rastreador
Rastreador de Extremos Zig-Zag
Linhas Automáticas de Suporte e
Resistência de Tendência
Todos os Níveis de Suporte e
Resistência
Mapa de Liquidação de Alavancagem
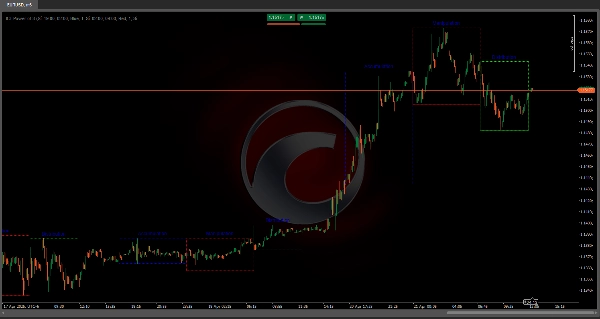
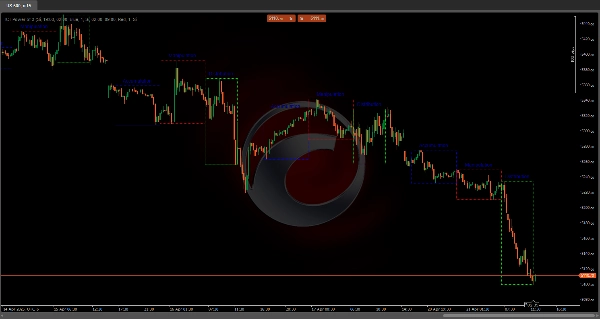
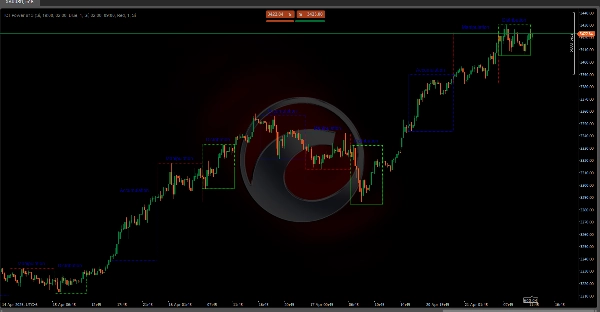
ICT POWER OF 3 ⚡📊
Este indicador automatiza a teoria ICT "Power of 3" plotando três zonas-chave do mercado no seu gráfico—Acumulação, Manipulação e Distribuição—usando timeframes refinados que capturam tanto sessões puras quanto suas sobreposições. O resultado é um "mapa" 🗺️ visual mostrando onde grandes players definem suportes, caçam stops e impulsionam tendências—sem necessidade de análise manual de velas ou pavios!
Por Que Este Algoritmo é Importante no Trading 💡
Visibilidade Institucional 👀: Ao automatizar a detecção de zonas onde "Smart Money" acumula, manipula e distribui, você elimina suposições e vê instantaneamente onde a liquidez real flui.
Detecção de Armadilhas e Liquidez 🎯: A fase de Manipulação (sobreposição Europa-NY) é onde ocorrem caças a stops —identificá-las permite entrar em trades com menor risco.
Confirmação de Tendência 🚀: A zona pura de Distribuição NY captura o núcleo do momentum direcional—operar em sincronia com ele aumenta as taxas de sucesso.
Consistência 🔄: Usar timeframes fixos e visuais padronizados elimina o viés emocional e simplifica os backtests.
Detecção das Três Fases (Foco na Sobreposição) 🔍
1️⃣ Acumulação (Sobreposição Ásia + Tóquio/Londres: 19h – 2h EST)
- Início ⏳: Na primeira vela das 19h EST, uma "caixa" se abre, capturando a máxima/mínima inicial.
- Acompanhamento 🔄: Se o preço rompe o intervalo (nova máxima/mínima), a caixa se expande em tempo real.
- Fechamento 🚪: Às 2h EST, a caixa se bloqueia, marcando onde Smart Money absorveu ordens com baixa volatilidade.
2️⃣ Manipulação (Sobreposição Europa + Londres/NY: 2h – 9h EST)
- Início ⏳: Detectado na primeira vela das 2h EST.
- Comportamento 🎭: Destaca falsos rompimentos de extremos anteriores—cada rejeição é visualmente acompanhada.
- Fechamento 🚪: Termina às 9h EST, revelando onde caças a stops foram concentradas.
3️⃣ Distribuição (Sessão Pura NY: 9h – 14h EST)
- Início ⏳: Começa com a vela das 9h EST.
- Evolução 📈: A caixa cresce com a tendência mais forte—onde as instituições liberam posições.
- Fechamento 🚪: Finaliza às 14h EST, marcando a fase de maior momentum e volume.
Gerenciamento do Dia & Limpeza Automática 🧹
Para evitar poluição no gráfico, o indicador mantém apenas os últimos N dias (configurável). Uma vez excedido, ele deleta automaticamente zonas antigas—bordas, preenchimentos e etiquetas—mantendo sua análise limpa e focada em dados recentes.
Resumo
The indicator identifies:
1. Accumulation phase (7 PM – 2 AM EST, Asia + Tokyo/London overlap), marking where smart money absorbs orders with low volatility.
2. Manipulation phase (2 AM – 9 AM EST, Europe + London/New York overlap), highlighting false breakouts and stop hunts.
3. Distribution phase (9 AM – 2 PM EST, pure New York session), showing where institutions release positions during the highest momentum and volume.
ICT Power of 3 enhances trading by providing institutional visibility, trap and liquidity detection, and trend confirmation. It uses fixed timeframes and standardized visuals to reduce emotional bias and simplify backtesting. The indicator also manages chart clutter by automatically deleting old zones beyond a configurable number of days, keeping the analysis focused on recent data. It supports markets including commodities, cryptocurrencies (BTC, ETH), and symbols like BTCUSD and XAUUSD.
Avaliações de clientes
5 | 100 % | |
4 | 0 % | |
3 | 0 % | |
2 | 0 % | |
1 | 0 % |