
Price Action
Indikator
Version 1.0, Jul 2025
Windows, Mac
Seit 03/10/2024
177
Verkäufe
45.37K
Kostenlose Installationen
Beschreibung
Zusammenfassung
KI-Zusammenfassung
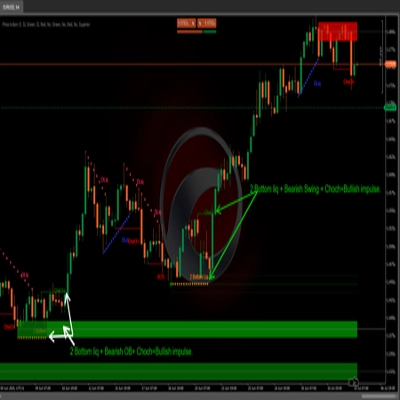
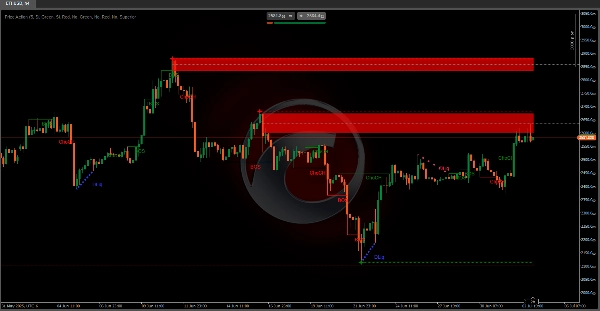
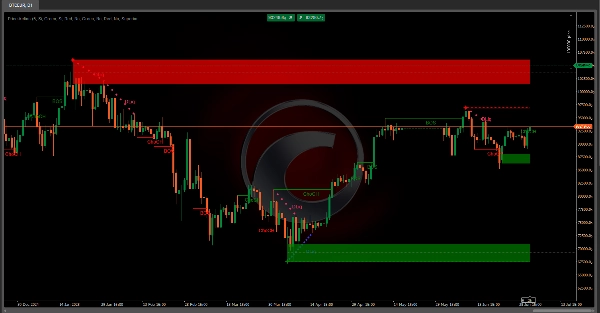
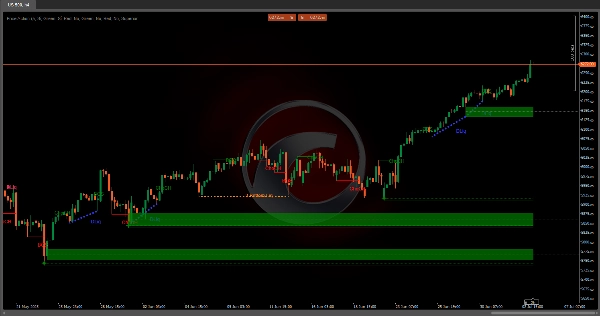
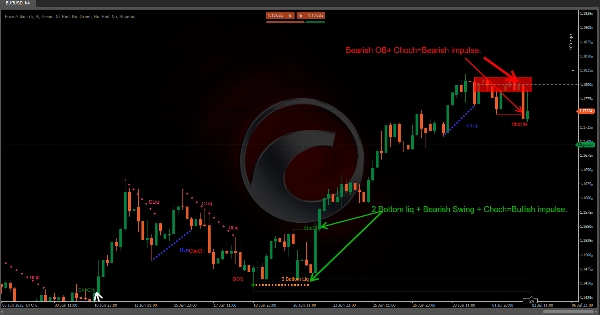
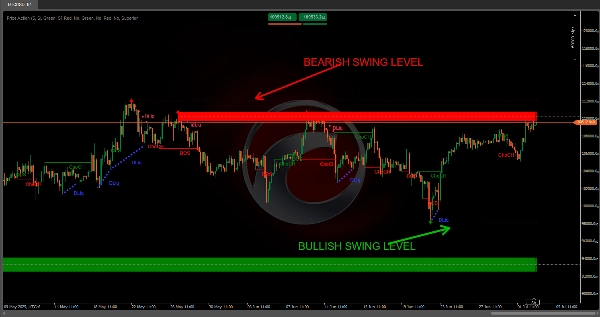
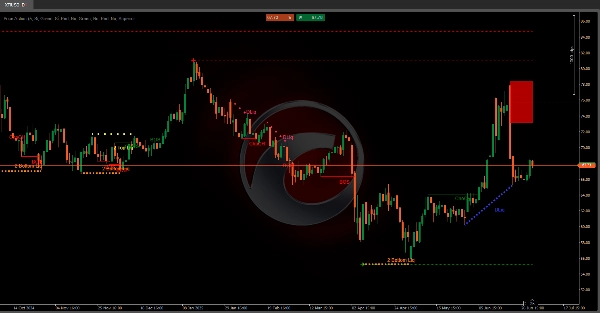
Price Action (Smart Money Approach) is an advanced technical indicator that integrates multiple price action concepts to analyze market behavior. It combines Market Structure, Swing Levels, Order Blocks, and Liquidity Zones (including 2 Tops and 2 Bottoms patterns) to identify key entry and exit points, trends, support and resistance levels, and institutional zones where price reacts.
The indicator is based on the Smart Money philosophy, recognizing that markets are driven by institutional players such as banks and market makers who create patterns to hide operations during accumulation/distribution, hunt liquidity (retail stop losses), and fuel explosive moves in unbalanced markets.
Key components include:
- Order Blocks: Zones of institutional buying (bullish) or selling (bearish) identified by volume spikes near highs or lows.
- Swing Levels: Key highs and lows defining market structure, with breaks signaling bullish or bearish continuation.
- Break of Structure (BoS): Decisive breaks of swing highs or lows indicating trend direction.
- Change of Character (ChoCh): Structural shifts signaling trend reversals.
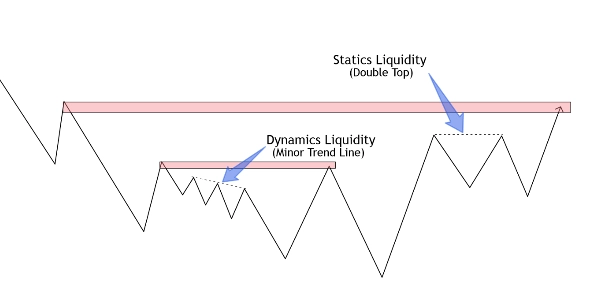
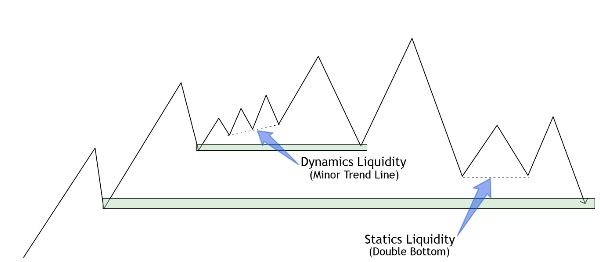
- Liquidity Zones: Static (horizontal clustered highs/lows) and dynamic (trendlines) levels highlighting institutional stop hunts and congestion.
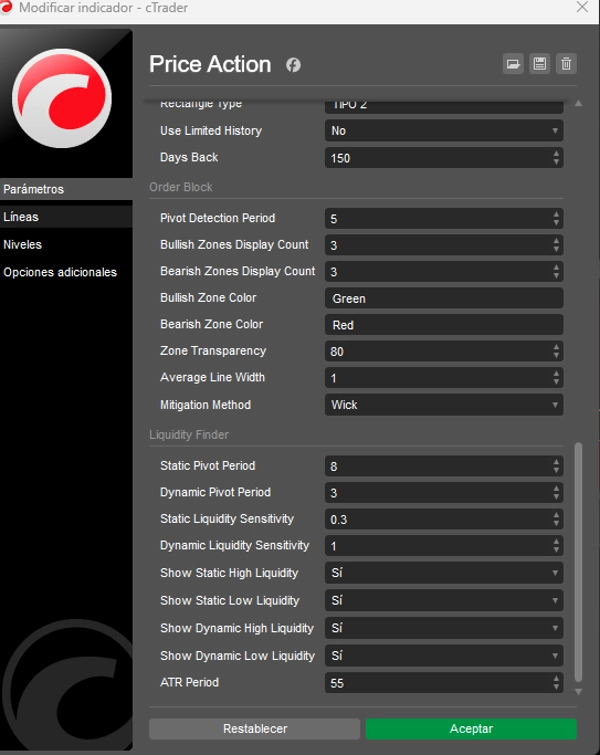
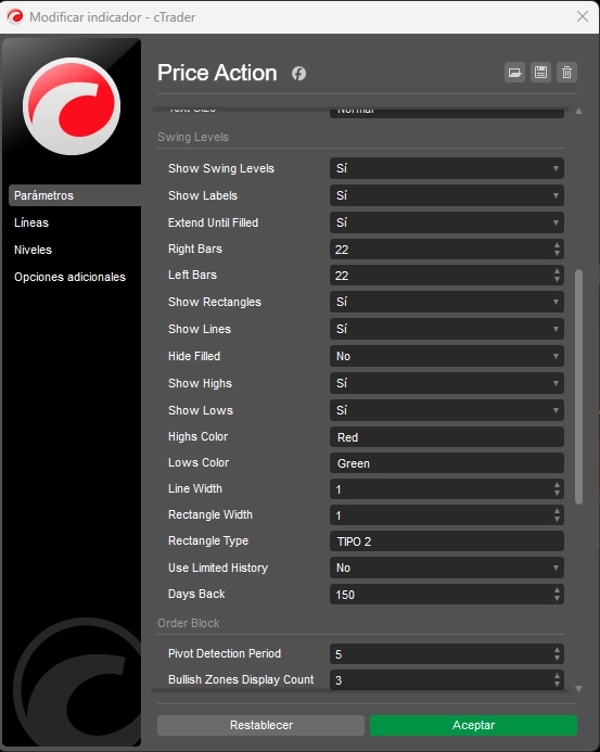
Applications cover trend and reversal identification, support/resistance location, spotting institutional order blocks, and predicting price targets through liquidity zones. Parameter tuning options allow adaptation for day trading, swing trading, and ranging markets.
The indicator is based on the Smart Money philosophy, recognizing that markets are driven by institutional players such as banks and market makers who create patterns to hide operations during accumulation/distribution, hunt liquidity (retail stop losses), and fuel explosive moves in unbalanced markets.
Key components include:
- Order Blocks: Zones of institutional buying (bullish) or selling (bearish) identified by volume spikes near highs or lows.
- Swing Levels: Key highs and lows defining market structure, with breaks signaling bullish or bearish continuation.
- Break of Structure (BoS): Decisive breaks of swing highs or lows indicating trend direction.
- Change of Character (ChoCh): Structural shifts signaling trend reversals.
- Liquidity Zones: Static (horizontal clustered highs/lows) and dynamic (trendlines) levels highlighting institutional stop hunts and congestion.
Applications cover trend and reversal identification, support/resistance location, spotting institutional order blocks, and predicting price targets through liquidity zones. Parameter tuning options allow adaptation for day trading, swing trading, and ranging markets.
Indikatorprofil
Diskussion
Kundenbewertungen
0.0
Bewertungen: 0
Kundenbewertungen
Bisher gibt es keine Bewertungen für dieses Produkt. Haben Sie es schon ausprobiert? Dann können Sie die erste Person sein, die andere darüber informiert!
Häufig gestellte Fragen (FAQ)
Über den cTrader Store verfügbare Produkte, einschließlich Handelsbots, Indikatoren und Plugins, werden von externen Entwicklern bereitgestellt und nur zu Informations- und technischen Zugriffszwecken verfügbar gemacht. cTrader Store ist kein Broker und erbringt keine Anlageberatung, persönlichen Empfehlungen oder eine Garantie für zukünftige Performance.





























![„[Hamster-Coder] Pivot Points MTF“-Logo](https://cdn.ctrader.com/image/webp/4c143e5a-309c-40e3-a578-f04d1e133ffa_31159)
Preis
Seit 03/10/2024
177
Verkäufe
45.37K
Kostenlose Installationen