설명
Pinescriptlabs 스토어 지표: 🤖Pinescriptlabs 스토어 cBots:
SmartTrend Support & Resistance Lines Gold & BTC Breakout Session Pivots(new) YieldShield" 🛡️
Dynamic Market Structure
전환점 분석
Multi-Level Candle Bias
Tracker
ICT POWER OF 3 ⚡📊
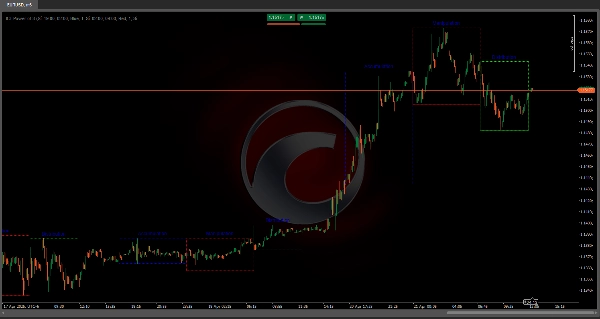
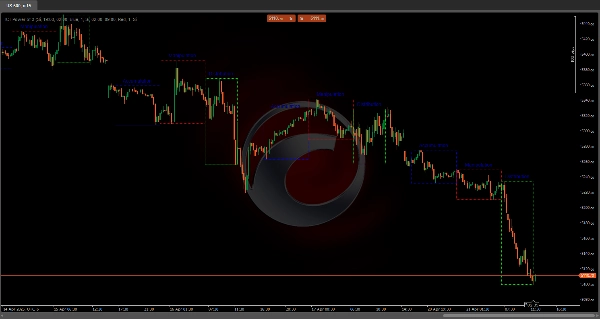
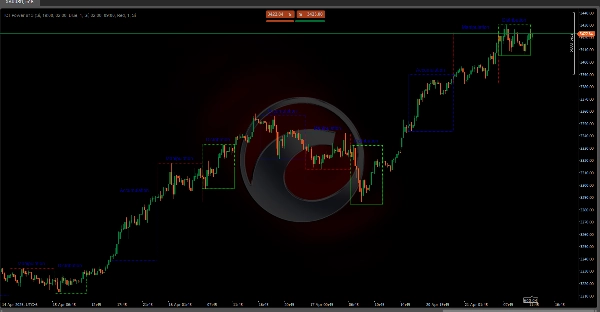
이 지표는 ICT "Power of 3" 이론을 자동화하여 차트에 세 가지 주요 시장 구역—축적, 조작, 분배—를 표시합니다. 순수 세션과 그 겹침을 모두 포착하는 정제된 시간 프레임을 사용합니다. 결과는 시각적 "지도" 🗺️로, 큰 플레이어들이 지지선을 설정하고, 스톱을 사냥하며, 추세를 주도하는 위치를 보여줍니다—수동 캔들 또는 심지 분석이 필요 없습니다!
이 알고리즘이 거래에서 중요한 이유 💡
기관 가시성 👀: "스마트 머니"가 축적, 조작, 분배하는 구역을 자동으로 감지하여 추측을 제거하고 실제 유동성 흐름을 즉시 볼 수 있습니다.
함정 및 유동성 감지 🎯: 조작 단계(유럽-뉴욕 겹침)는 스톱 사냥이 발생하는 구역으로, 이를 발견하면 낮은 위험으로 거래에 진입할 수 있습니다.
추세 확인 🚀: 순수 뉴욕 분배 구역은 방향성 모멘텀의 핵심을 포착하며, 이에 맞춰 거래하면 성공률이 향상됩니다.
일관성 🔄: 고정된 시간 프레임과 표준화된 시각 자료를 사용하여 감정적 편향을 제거하고 백테스팅을 단순화합니다.
세 단계 감지 (겹침 집중) 🔍
1️⃣ 축적 (아시아 + 도쿄/런던 겹침: 오후 7시 – 오전 2시 EST)
- 시작 ⏳: 첫 번째 오후 7시 EST 캔들에서 "박스"가 열리며 초기 고가/저가를 포착합니다.
- 추적 🔄: 가격이 범위를 돌파(새 고가/저가)하면 박스가 실시간으로 확장됩니다.
- 종료 🚪: 오전 2시 EST에 박스가 잠기며, 그곳에서 스마트 머니가 낮은 변동성로 주문을 흡수한 위치를 표시합니다.
2️⃣ 조작 (유럽 + 런던/뉴욕 겹침: 오전 2시 – 오전 9시 EST)
- 시작 ⏳: 첫 번째 오전 2시 EST 캔들에서 감지됩니다.
- 행동 🎭: 이전 극단값의 거짓 돌파를 강조하며, 각 거절이 시각적으로 추적됩니다.
- 종료 🚪: 오전 9시 EST에 종료되며, 스톱 사냥이 집중된 위치를 보여줍니다.
3️⃣ 분배 (순수 뉴욕 세션: 오전 9시 – 오후 2시 EST)
- 시작 ⏳: 오전 9시 EST 캔들로 시작합니다.
- 진행 📈: 박스가 가장 강한 추세와 함께 성장하며, 기관들이 포지션을 해제합니다.
- 종료 🚪: 오후 2시 EST에 마감되며, 가장 높은 모멘텀 및 거래량 단계를 표시합니다.
일 관리 및 자동 정리 🧹
차트 혼잡을 피하기 위해, 이 지표는 최근 N일만 유지하며(설정 가능), 초과 시 오래된 구역들을 자동으로 삭제—경계, 채우기, 라벨 포함—하여 분석을 깨끗하고 집중된 상태로 유지합니다.
요약
The indicator identifies:
1. Accumulation phase (7 PM – 2 AM EST, Asia + Tokyo/London overlap), marking where smart money absorbs orders with low volatility.
2. Manipulation phase (2 AM – 9 AM EST, Europe + London/New York overlap), highlighting false breakouts and stop hunts.
3. Distribution phase (9 AM – 2 PM EST, pure New York session), showing where institutions release positions during the highest momentum and volume.
ICT Power of 3 enhances trading by providing institutional visibility, trap and liquidity detection, and trend confirmation. It uses fixed timeframes and standardized visuals to reduce emotional bias and simplify backtesting. The indicator also manages chart clutter by automatically deleting old zones beyond a configurable number of days, keeping the analysis focused on recent data. It supports markets including commodities, cryptocurrencies (BTC, ETH), and symbols like BTCUSD and XAUUSD.
고객 리뷰
5 | 100 % | |
4 | 0 % | |
3 | 0 % | |
2 | 0 % | |
1 | 0 % |