
الوصف
🚀 أكثر من 10,000 متداول يستخدمون بالفعل أفضل المؤشرات🏆
اكتشف لماذا يختارنا المحترفون – أقوى الأدوات على cTrader (المؤشرات، الخوارزميات، وcBots) في انتظارك.
👉 احصل على جميع أنظمتنا الأفضل هنا:
_______________________________________________
📌 مؤشرات هيكل السوق
· ✅ هيكل السوق المتقدم: Bos, Choch, SwinLevels, كتل الأوامر، هيكل السوقوآداة العثور على السيولة
· 🔄 تحليل هيكل السوق الديناميكي لنقاط التحول
· 🧱 كتلة الأوامر
· ⚖️ اختلال السوق
· ⛓️ BOS & CHOCH
· 🧠 قوة ICT 3
_______________________________________________
🔚 أنظمة الخروج الذكية
_______________________________________________
📐 مؤشرات ZigZag
· ➖ ZigZag
_______________________________________________
🧱 مؤشرات الدعم والمقاومة
· 🟩 خطوط دعم ومقاومة SmartTrend
· 🧱 جميع مستويات الدعم والمقاومة
_______________________________________________
📊 مؤشرات الاتجاه والقناة
· 📊 سوبرتريند
· ⭐ قناة SSL المميزة
_______________________________________________
💧 أدوات الحجم والسيولة
· 📉 خريطة تصفية الرافعة المالية
_______________________________________________
⚡ مؤشرات الزخم وRSI
· 📈 مُشغل اتجاه RSI
· 🔎 تتبع ميل الشمعة متعدد المستويات
Tracker
_______________________________________________
🔮 أدوات التنبؤ والإسقاط
· 📐 التنبؤ بناءً على Linreg& ATR
· 📏 انحدار فيبوناتشي الخطي متعدد الأطر الزمنية
· 📈 مشروع تدفق السوق المدعوم بالحجم
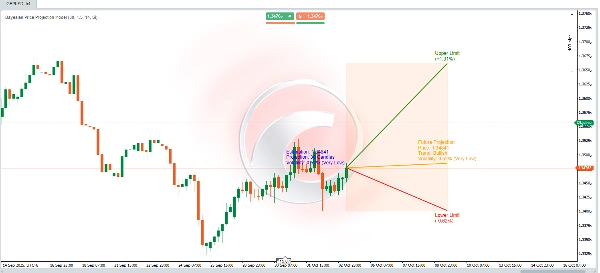
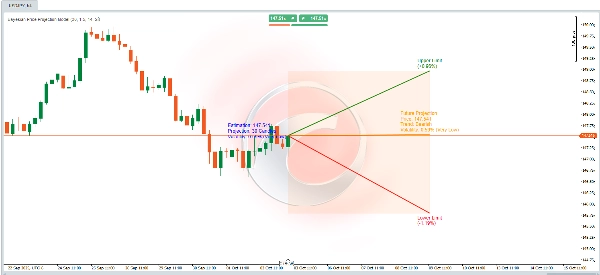
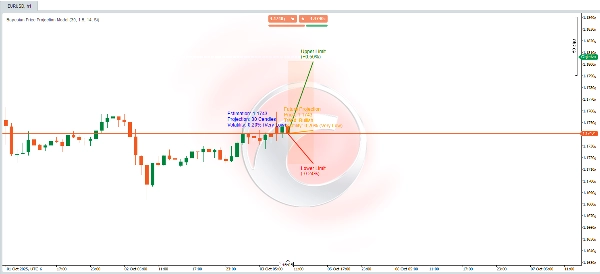
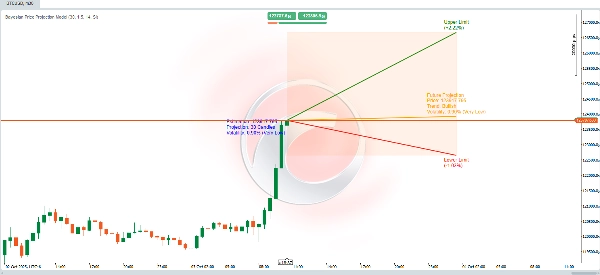
📊 خوارزمية إسقاط السعر الديناميكي 📈
تجمع هذه الخوارزمية بين **الحسابات الإحصائية**، **التحليل الفني**، و**نظرية بايز** لتوقع سعر مستقبلي مع توفير **نطاقات عدم اليقين** التي تمثل الحدود العليا والدنيا. تم تصميم الحسابات لضبط الإسقاطات من خلال النظر في **الاتجاهات**، **التقلبات**، والاحتمالات التاريخية للوصول إلى مستويات قياسية جديدة.
إليك كيف تعمل:
🚀 إسقاط السعر المستقبلي
تقدير ديناميكي للسعر المستقبلي بناءً على ثلاثة عناصر رئيسية:
1. **الاتجاه**: يحدد ما إذا كان السوق مهيأ للتحرك صعودًا أو هبوطًا.
2. **التقلب**: يقيس حجم التغير المتوقع بناءً على التقلبات التاريخية.
🧠 **تعديل احتمالي بايزي**
- يتم حساب الاحتمالات الشرطية باستخدام **صيغة بايز**:
\[
P(A|B) = \frac{P(B|A) \cdot P(A)}{P(B)}
\]
هذا النموذج يستخدم الأحداث المستقبلية بناءً على المعلومات الشرطية:
- **احتمالية الوصول إلى أعلى مستوى قياسي جديد** إذا كان السعر يتجه صعودًا.
- **احتمالية الوصول إلى أدنى مستوى قياسي جديد** إذا كان السعر يتجه هبوطًا.
- هذه الاحتمالات تحسن تقدير السعر المستقبلي من خلال النظر في:
- **زيادة التقلب** تزيد من احتمال الوصول إلى مستويات قصوى (عليا/دنيا).
- **اتجاهات السوق** تؤثر على اتجاه حركة السعر المتوقع.
🌟 **حساب التقلب**
- يتم قياس التقلب باستخدام مؤشر **ATR (المتوسط الحقيقي المدى)** بفترة 14. يعكس هذا متوسط سعة تقلبات السعر.
- للتعبير عن التقلب كنسبة مئوية، يتم تطبيع ATR بقسمته على سعر الإغلاق وضربه في 200.
- ثم يتم تصنيف التقلب إلى مستويات وصفية (مثل **منخفض جدًا**، **منخفض**، **معتدل**، إلخ) لتفسير أفضل.
---
🎯 **حدود الانحراف (العليا والدنيا)**
- تشكل الحدود العليا والدنيا **نطاقًا متوقعًا** حول السعر المستقبلي المقدر، مما يوفر إطارًا لعدم اليقين.
- يتم حساب هذه الحدود بضبط ATR باستخدام:
- **معامل** يحدده المستخدم (`factor_desviacion`).
- **الاحتمالات البايزية** المحسوبة سابقًا.
- **الجذر التربيعي للفترة المتوقعة** (`proyeccion_dias`)، مع الأخذ في الاعتبار أن عدم اليقين يزداد مع مرور الوقت.
🔍 **تفسير النموذج**
يمكن اعتبار هذا نموذجًا احتماليًا ديناميكيًا يقوم بـ:
- دمج **التحليل الفني** (الاتجاهات وATR).
- تحسين الاحتمالات باستخدام **نظرية بايز**.
- توفير **نطاق إسقاط بصري** لمساعدتك على فهم تحركات السعر المستقبلية المحتملة والشكوك المرتبطة بها.
⚡ سواء كنت تحلل **أسواق متقلبة** أو تؤكد **سيناريوهات صعودية/هبوطية**، هذه الأداة تزودك بنهج قوي قائم على البيانات! 🚀


![شعار "[Hamster-Coder] Bollinger Bands"](https://cdn.ctrader.com/image/webp/21d8e5d6-fb11-4bac-b9ee-cd05c2b76804_30327)


