Description
📈 Moyenne Mobile de Signal 📉
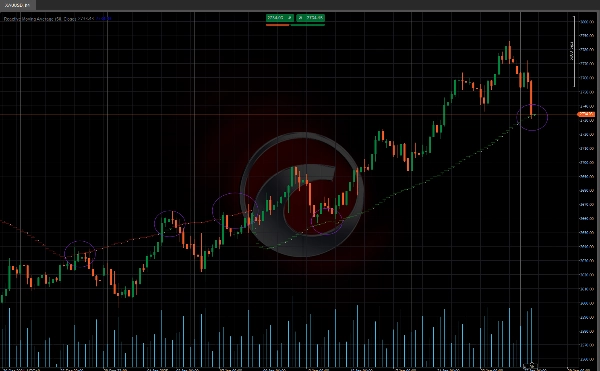
La Moyenne Mobile de Signal est un indicateur qui combine une Moyenne Mobile Simple (SMA) avec un calcul de corrélation dynamique pour mieux s'adapter aux conditions du marché. 🎯 Cet indicateur ajuste sa sensibilité en fonction de la force de la tendance, ce qui en fait un outil puissant pour identifier les tendances et filtrer le bruit du marché. 🌟
Caractéristiques Clés 🔑
📊 Moyenne Mobile Ajustée :
- La ligne de moyenne mobile s'ajuste dynamiquement en fonction de la corrélation entre le prix et le temps.
- Dans les marchés fortement tendance, la moyenne mobile se déplace plus rapidement pour suivre le prix. 🚀
- Dans les marchés latéraux, la moyenne mobile reste plus stable, réduisant les faux signaux. 🛑
🔢 Calcul de Corrélation :
- L'indicateur calcule la corrélation entre le prix et le temps en utilisant la formule de Pearson.
- Il ajuste la moyenne mobile en fonction du coefficient de détermination (R²). 🧮
👀 Visualisation :
- Affichage clair et intuitif pour une interprétation facile. 📉📈
Comment Utiliser l'Indicateur 🛠️
🔍 Identification de la Tendance :
- Tendance Haussière : Lorsque le prix est au-dessus de la moyenne mobile corrélée. 🐂
- Tendance Baissière : Lorsque le prix est en dessous de la moyenne mobile corrélée. 🐻
✅ Confirmation du Signal :
- Utilisez la moyenne mobile ajustée comme niveau dynamique de support ou de résistance. 🛡️
- Combinez cet indicateur avec d'autres outils techniques pour confirmer les signaux. 🔄
Ajustement de la Moyenne Mobile ⚙️
L'algorithme ajuste la moyenne mobile en fonction de la valeur de R² :
- Si R² > 0.5 (corrélation significative) :
-
- La moyenne mobile est ajustée en utilisant une combinaison pondérée entre la valeur actuelle de la SMA et la valeur précédente de la moyenne mobile ajustée (_ma).
- La pondération dépend de la valeur de R². ⚖️
- Si R² ≤ 0.5 (corrélation non significative) :
-
- La moyenne mobile est ajustée en soustrayant une valeur proportionnelle à la différence absolue entre la valeur actuelle de la SMA et la valeur précédente de la moyenne mobile ajustée. 🔄
- Indicateurs du Store Ctrader :
Sessions de Gap de Valeur Juste
Structure Dynamique du Marché
Analyse des Points de Retour
Fibonacci Linéaire
Régression Multi-échelle
Gradient de Tendance Dynamique
Biais de Chandelle Multi-niveaux
Tracker
Lignes de Tendance Automatiques de Support et
Résistance
Tous les Niveaux de Support et
Résistance
Résumé
Key functionalities include:
- **Adjusted Moving Average**: The moving average line dynamically adapts according to the correlation between price and time. It accelerates in strong trending markets to closely follow price movements and stabilizes in sideways markets to minimize false signals.
- **Correlation Calculation**: Utilizes the Pearson formula to compute the correlation between price and time, adjusting the moving average based on the coefficient of determination (R²).
- **Moving Average Adjustment**: When R² is greater than 0.5, the moving average is updated using a weighted combination of the current SMA and the previous adjusted value, with weights depending on R². For R² less than or equal to 0.5, adjustments are made by subtracting a value proportional to the difference between the current SMA and prior adjusted average.
- **Visualization**: Provides a clear and intuitive display for easy interpretation.
Usage involves identifying bullish trends when price is above the adjusted moving average and bearish trends when below. The indicator can also serve as a dynamic support or resistance level and be combined with other technical tools for signal confirmation.
Avis clients
5 | 100 % | |
4 | 0 % | |
3 | 0 % | |
2 | 0 % | |
1 | 0 % |