Deskripsi
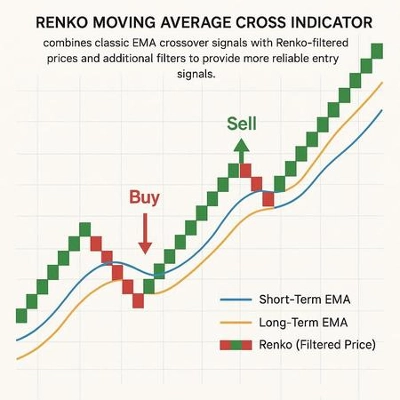
📈 Trend Master Pro MultiMA – Alat Deteksi Tren Terbaik 🚀
Indikator ini menampilkan 20 rata-rata bergerak dengan periode berbeda (5, 10, 15, 20, 25, 30, 35, 40, 45, 50, 55, 60, 65, 70, 75, 80, 85, 90, 95, dan 100). Untuk masing-masing:
1️⃣ 📊 Pilih Jenis Perhitungan Anda: Pilih antara SMA, EMA, RMA, WMA, atau VWMA sesuai preferensi Anda. Opsional, Anda dapat mengaktifkan perataan regresi linier untuk mengurangi noise dan mendapatkan tren yang lebih jelas.
2️⃣ 📏 Tentukan Saluran Referensi: Sebuah saluran berbasis rentang harga dihitung menggunakan 200 candle terakhir. Lebar saluran dapat disesuaikan, melebar dengan volatilitas harga yang lebih tinggi dan menyempit di pasar yang lebih tenang.
3️⃣ 📈 Bandingkan Rata-Rata Bergerak dengan Saluran: Setiap rata-rata bergerak dianalisis terkait dengan tinggi saluran dan nilai tertinggi & terendahnya selama periode tertentu (default: 20 candle).
- 📊 Jika selisih antara nilai tertinggi dan terendah rata-rata bergerak melebihi lebar saluran, ini menandakan tren kuat (bullish atau bearish).
- ⚖️ Jika selisih berada di dalam atau dekat saluran, pasar dianggap netral atau bergerak menyamping.
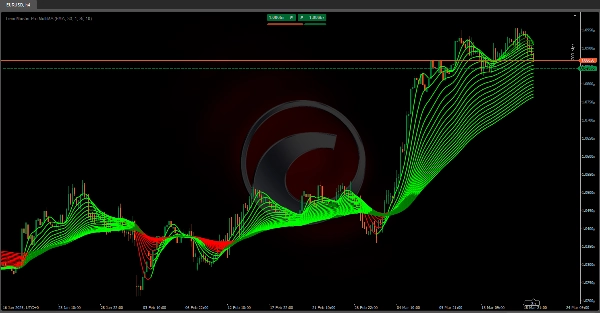
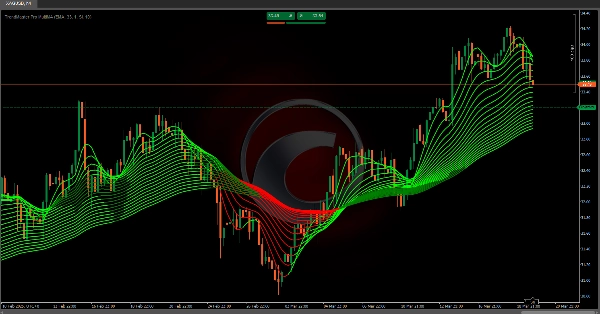
4️⃣ 🎨 Sistem Pewarnaan Berdasarkan Tren: Setiap segmen dari rata-rata bergerak diwarnai sesuai kekuatan dan arah tren:
- 🟢 Hijau = Tren bullish terdeteksi
- 🔴 Merah = Tren bearish terdeteksi
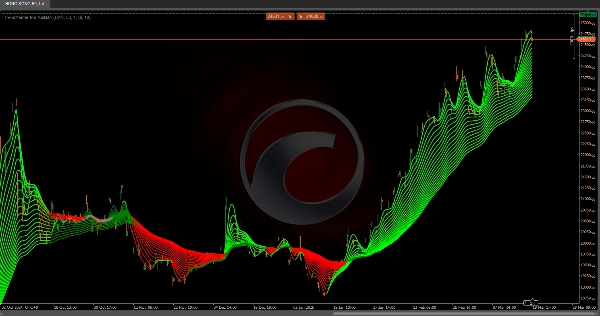
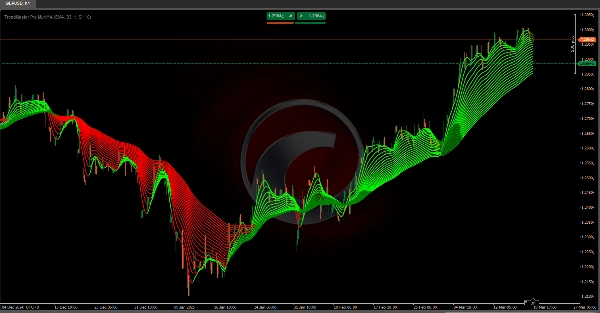
5️⃣ 📉 Visualisasi Tren: Indikator menghubungkan setiap nilai rata-rata bergerak dari candle ke candle, membentuk struktur kipas dari garis tren. Setiap rata-rata bergerak secara dinamis menyesuaikan warnanya berdasarkan tren yang dihitung.
✅ Mengapa Menggunakan Trend Master Pro MultiMA?
Pendekatan adaptif multi-timeframe ini—menggabungkan beberapa rata-rata bergerak, saluran harga, dan perataan regresi—membantu mengidentifikasi dengan cepat fase pasar:
🔹 Tren bullish ✅
🔹 Tren bearish ❌
🔹 Pergerakan menyamping/ranging 🔄
🚀 Sempurna untuk trader yang mencari wawasan visual yang jelas untuk membuat keputusan lebih baik dalam timeframe jangka pendek, menengah, dan panjang! 📊🔥
Indikator Toko Ctrader:
Dynamic Market Structure
Analisis Titik Balik
Fibonacci Linear
Regresi Multi-timeframe
Multi-Level Candle Bias
Tracker
Auto Support and
Resistance Trend Lines
Ringkasan
Each moving average is compared against this channel and its own highs and lows over a defined period (default 20 candles). If the range of a moving average exceeds the channel width, it signals a strong bullish or bearish trend; if within or near the channel, the market is considered neutral or ranging. The indicator visually represents trends by connecting moving average values candle-to-candle, forming a fan-like structure of trendlines. Trend strength and direction are indicated by color coding: green for bullish and red for bearish trends.
This multi-timeframe adaptive tool integrates multiple moving averages, price channels, and regression smoothing to help traders quickly identify market phases—bullish, bearish, or ranging—across short, medium, and long-term timeframes.
Ulasan pelanggan
5 | 100 % | |
4 | 0 % | |
3 | 0 % | |
2 | 0 % | |
1 | 0 % |


![Logo "[Stellar Strategies] Inside Bar with Signals"](https://cdn.ctrader.com/image/webp/1d9e8bfa-3b2c-4440-bb37-5856902008a7_30683)