
Harmonic Pattern Indicators for cTrader
Review harmonic pattern indicators for cTrader that highlight potential forex reversal zones using structured price geometry. These tools help traders identify Gartley, Bat, Butterfly and other patterns while planning risk and targets.
Công cụ
So sánh công cụ
Câu hỏi thường gặp




So sánh công cụ
Sản phẩm | Đánh giá | Lượt tải | Lượt bán | Giá | Nền tảng tương thích |
|---|---|---|---|---|---|
CRT Pattern Indicator | 4.6 (16) | 6.16K | — | Miễn phí | Windows, Mac |
BOS & CHOCH | 5.0 (2) | — | 43 | $19 | Windows, Mac |
ZigZag | 4.3 (6) | 4.45K | — | Miễn phí | Windows, Mac |
VegaXLR - Chart Patterns Alerts | 4.3 (3) | — | 19 | $39 | Windows, Mac |
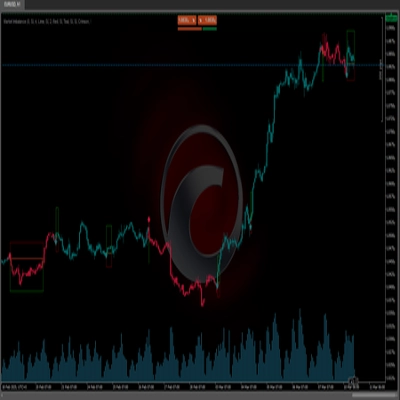
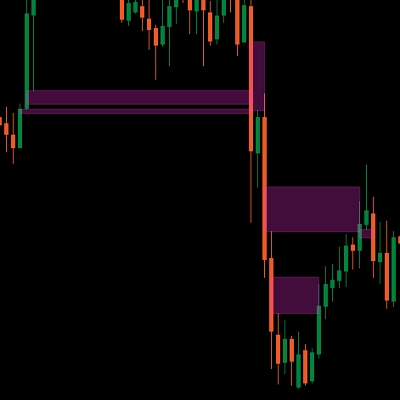
Market Imbalance | — | 738 | — | Miễn phí | Windows, Mac |
VegaXLR - Candlestick Patterns Alerts | 5.0 (4) | — | 14 | $19 | Windows, Mac |
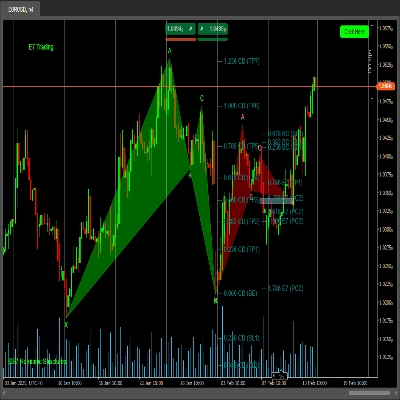
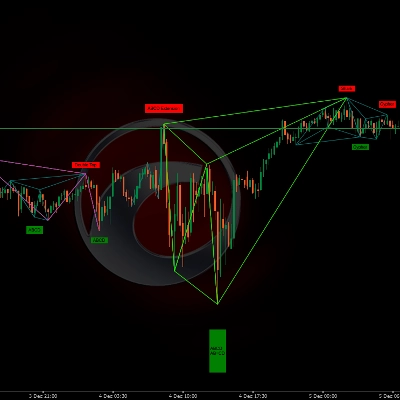
E7 Harmonic Structures Basic | 5.0 (2) | 705 | — | Miễn phí | Windows, Mac |
VegaXLR - Candlestick Patterns Pro | 5.0 (3) | — | 7 | $29 | Windows, Mac |
Repiptor Candlescope Lite | 5.0 (1) | 642 | — | Miễn phí | Windows, Mac |
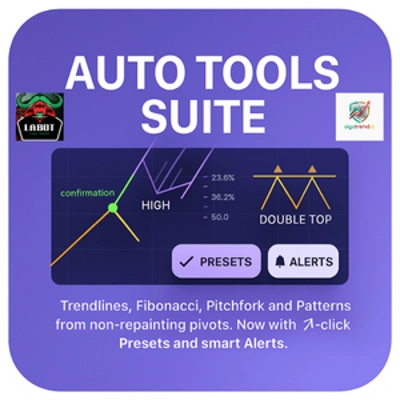
Auto Tools Suite | 4.3 (3) | — | 6 | $19 | Windows, Mac |
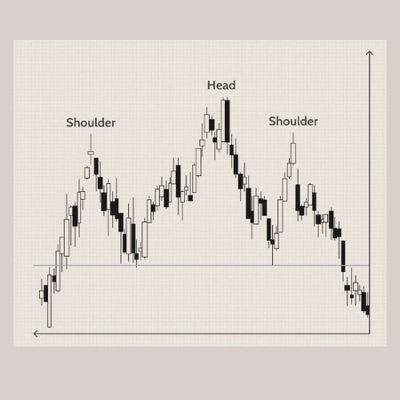
Head Shoulders Finder | 5.0 (1) | 514 | — | Miễn phí | Windows, Mac |
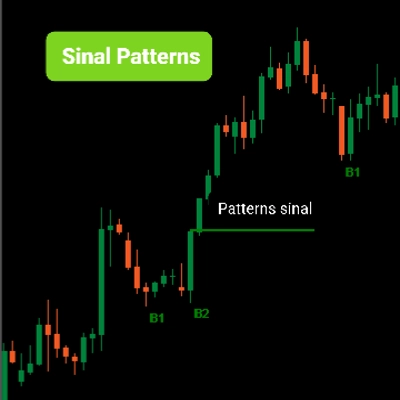
Pattern Signal Forex | 4.8 (4) | — | 5 | $20 | Windows, Mac |
Breakout Mode Patterns | — | 439 | — | Miễn phí | Windows, Mac |
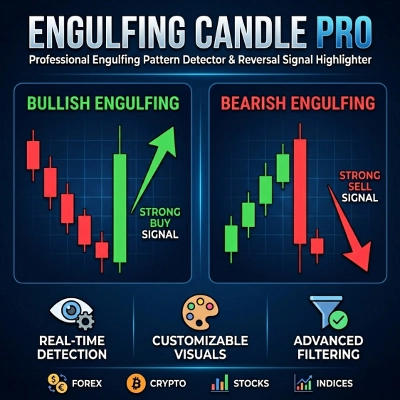
Engulfing CandlePRO | 4.5 (2) | — | 4 | $19 | Windows, Mac |
XABCD Master Detector | 5.0 (1) | 436 | — | Miễn phí | Windows, Mac |
LT_Ind_Candles | 4.0 (2) | — | 4 | $19 | Windows, Mac |
Pattern Scanner | 4.0 (1) | 402 | — | Miễn phí | Windows, Mac |
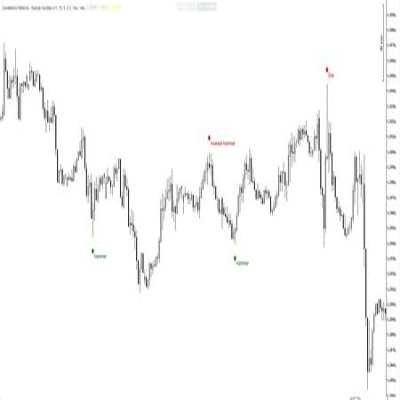
Candlestick Patterns - Special Candles | 4.5 (4) | — | 3 | $19 | Windows, Mac |
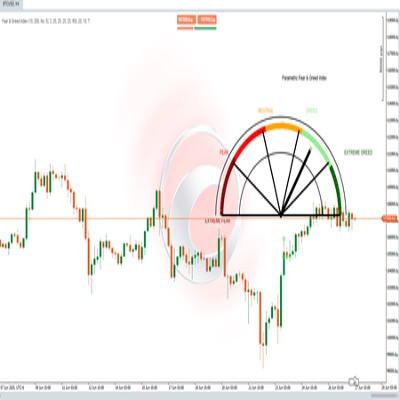
Fear & Greed Index | 5.0 (1) | 392 | — | Miễn phí | Windows, Mac |
Three Candle Patterns | 5.0 (2) | — | 3 | $19 | Windows, Mac |
3-Bar Reversal | — | 348 | — | Miễn phí | Windows, Mac |
Auto Chart Patterns | 4.6 (7) | — | 3 | $19 | Windows, Mac |
Inside CandlePRO | 5.0 (1) | 201 | — | Miễn phí | Windows, Mac |
Candlestick Signal Finder | 4.7 (3) | — | 2 | $19 | Windows, Mac |
dark-cloud | — | 198 | — | Miễn phí | Windows, Mac |
Two Candle Patterns | 4.6 (7) | — | 2 | $19 | Windows, Mac |
Double Top and Bottom Pivots | — | 190 | — | Miễn phí | Windows, Mac |
ADT_bigCandles | 4.8 (4) | — | 2 | $20 | Windows, Mac |
McDonalds Pattern-Bzier Curve | — | 133 | — | Miễn phí | Windows, Mac |
DMI 3 bar v2 | 5.0 (3) | — | 2 | $25 | Windows, Mac |
Gann High Low Activator | — | 115 | — | Miễn phí | Windows, Mac |
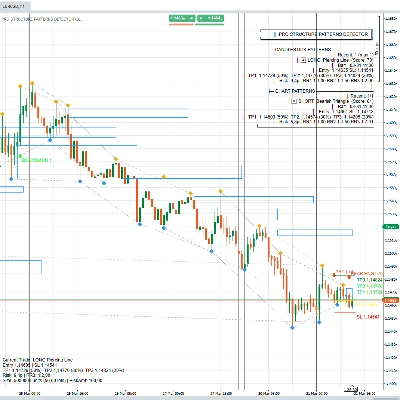
PRO STRUCTURE PATTERNS DETECTOR PRODUCT | — | — | 2 | $50 | Windows, Mac |
Advanced SSL Channel | 5.0 (1) | 96 | — | Miễn phí | Windows, Mac |
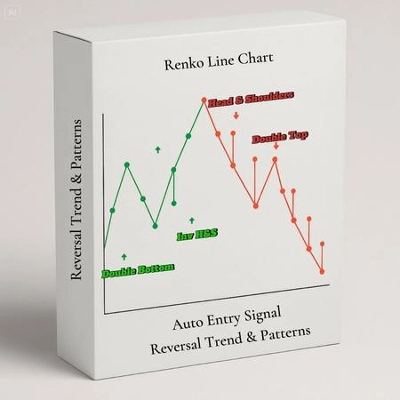
Renko Line Chart | — | — | 1 | $50 | Windows, Mac |
LT_FairValueGap | 5.0 (2) | — | 1 | $19 | Windows, Mac |
Harmonic | 4.3 (3) | — | 1 | từ $9 | Windows, Mac |
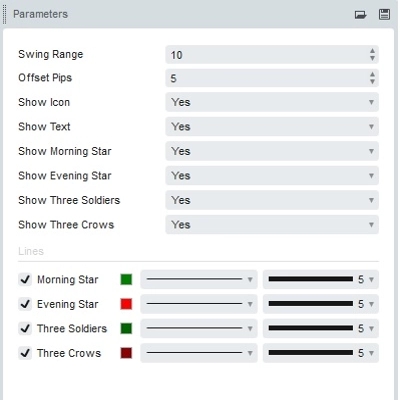
Morning Star On Chart | 4.7 (3) | — | — | $19 | Windows, Mac |
Câu hỏi thường gặp
A harmonic pattern is a five-point structure labelled X, A, B, C and D whose legs must fit set Fibonacci ratio ranges. Gartley, Bat, Butterfly and Crab differ in those ratios, and an indicator flags completion near D as a potential reversal zone.
They suit people already comfortable with swings and Fibonacci ratios, because judging whether a detected pattern is clean takes experience. Beginners can still use them to learn the shapes, but a scanner that labels many patterns quickly can encourage overtrading, and every pattern can fail.
Many watch the zone around point D for a reaction rather than treating it as an automatic entry, and wait for confirmation such as a rejection candle. Invalidation usually lies beyond the zone, and targets are often measured as retracements of the final CD leg.
They are applied mostly to forex pairs, gold and crypto such as BTCUSD, often on H1 and higher, where swings are clearer than on minute charts. In the Windows or Mac app, attach the scanner to a chart and check its settings for which patterns, symbols and timeframes it watches.
Point D is provisional until price turns, so if the move keeps extending past the ratio range the tool may redraw or delete the pattern. Detection also depends on swing-size and ratio-tolerance settings, so two tools can show different patterns on one chart, and history may look more accurate than live use.