Opis
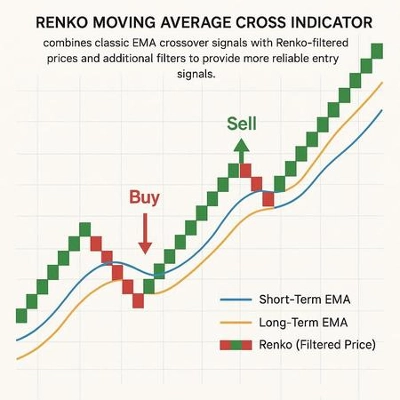
🌟 Regresja Liniowa Fibonacciego🌟
Wskaźnik Fibonacci Regression Bands to zaawansowane narzędzie techniczne, które łączy moc linii regresji z poziomami Fibonacciego, aby identyfikować trendy, strefy wsparcia/oporu oraz potencjalne punkty odwrócenia na rynkach finansowych. 📈 Ten wskaźnik oferuje wielowymiarową perspektywę poprzez analizę wielu ram czasowych jednocześnie (5m, 15m, 30m i 4h), co pozwala traderom precyzyjniej określać obszary konfluencji. ⏳
🎯 Co robi wskaźnik?
Wskaźnik tworzy kanały regresji oparte na historycznych danych cenowych i integruje je z poziomami zniesienia Fibonacciego, dostarczając kompleksową wizualną mapę kluczowych stref rynkowych. Analizując różne ramy czasowe, oferuje całościowy obraz zachowania cen, łącząc długoterminowe trendy z krótkoterminową akcją cenową. 📊
🔍 Główne składniki
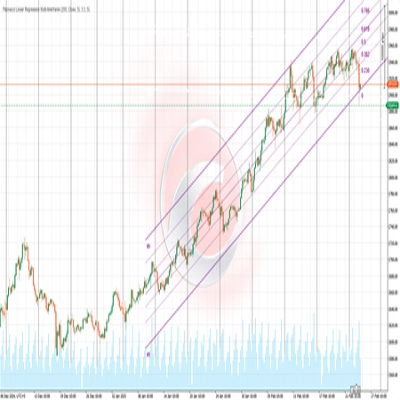
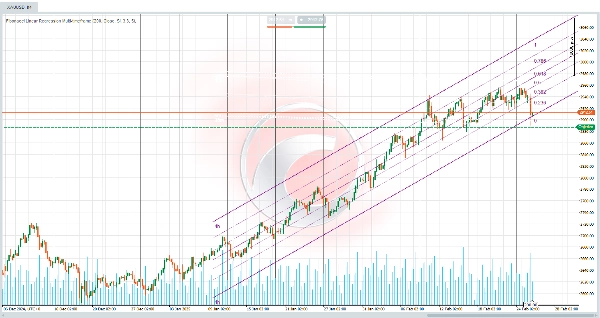
- Kanały regresji: Wskaźnik oblicza linie regresji liniowej na zadanym przez użytkownika okresie (domyślnie: 200 świec), aby pokazać ogólny trend cenowy. 📉📈
- Pasma odchylenia: Górne i dolne pasma rysowane wokół centralnej linii regresji, reprezentujące odchylenia statystyczne od ceny, podobne do wstęg Bollingera, ale oparte na regresji liniowej. 📐
- Poziomy Fibonacciego: Klasyczne poziomy Fibonacciego (0, 0.236, 0.382, 0.5, 0.618, 0.786 i 1) są nanoszone w kanale, oferując potencjalne punkty odbicia lub kontynuacji. 🔢
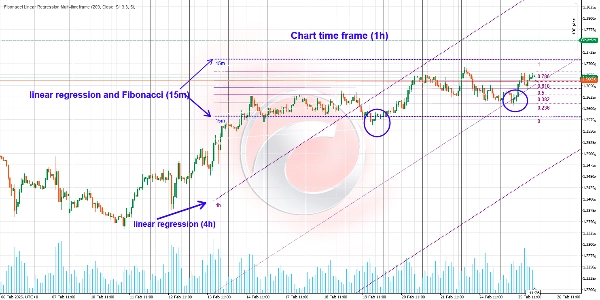
- Analiza wieloramowa: Jednoczesna analiza ram czasowych 5-minutowych, 15-minutowych, 30-minutowych i 4-godzinnych, z każdą reprezentowaną innym kolorem, pomaga zidentyfikować strefy, gdzie wiele ram czasowych się pokrywa. 🎨
🔄 Wielowymiarowa analiza rynku
Ta strategia pozwala spojrzeć na rynek z wielu perspektyw, integrując długoterminowe trendy z krótkoterminowymi ruchami cen. Podejście to umożliwia:
- Dynamiczne dostosowywanie transakcji w miarę rozwoju rynku. 🔄
- Przełączanie się między ramami czasowymi w razie potrzeby. ⏱️
- Chwytanie dużych ruchów w ramach głównego trendu. 🚀
- Wykorzystywanie mniejszych wahań do optymalizacji punktów wejścia i wyjścia. 🎯
🔄 Interakcja między ramami czasowymi
4-godzinna rama czasowa z kanałem regresji
- Daje wgląd w dominujący trend. 💪
- Stanowi solidną podstawę do oceny ogólnego kierunku rynku.
- W tym kontekście poziomy Fibonacciego mogą być wyłączone, aby uniknąć zagracenia wykresu.
- Skupienie pozostaje na kanale regresji pokazującym przeważający trend.
Niższe ramy czasowe z regresją i Fibonaccim
- Aktywuj linie regresji i poziomy Fibonacciego na krótszych ramach czasowych (5m, 15m lub 30m).
- Uzyskaj precyzyjniejsze sygnały w kontekście szerszego trendu.
- Poziomy Fibonacciego pomagają zidentyfikować potencjalne punkty wejścia i wyjścia w ramach większej ramy czasowej.
📊 Jak interpretować wyniki
Identyfikacja trendów
- Kierunek centralnej linii regresji wskazuje dominujący trend (wzrostowy, spadkowy lub boczny). 📈📉➡️
- Nachylenie linii sugeruje siłę trendu — strome nachylenia wskazują na silniejsze trendy. 🔍
- Zbieżność linii regresji z różnych ram czasowych w tym samym kierunku oznacza silny i wiarygodny trend.
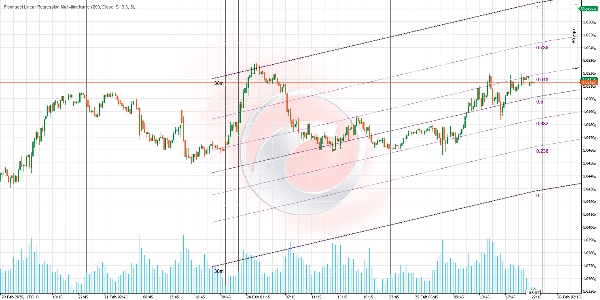
Strefy wsparcia i oporu
- Górne i dolne pasma działają jako dynamiczne strefy wsparcia i oporu. 🛡️
- Poziomy Fibonacciego w kanale dostarczają dodatkowego wsparcia/oporu, zwłaszcza na poziomach 0.618 i 0.382.
- Gdy poziomy Fibonacciego z różnych ram czasowych się pokrywają, tworzą strefy konfluencji o wysokim prawdopodobieństwie.
🌐 Identyfikacja stref konfluencji
Strefy konfluencji występują tam, gdzie linie regresji i poziomy Fibonacciego się pokrywają. Obszary te reprezentują prawdopodobne punkty znaczącej reakcji cenowej:
- Gdy zniesienie Fibonacciego pokrywa się z górną lub dolną krawędzią kanału regresji, działa jako silny punkt wsparcia lub oporu.
- Gdy linie regresji z różnych ram czasowych przecinają się lub zbliżają.
- Gdy poziomy Fibonacciego z wielu ram czasowych pokrywają się w określonym obszarze.
- Gdy cena odbija się dokładnie na poziomie Fibonacciego, który pokrywa się z linią kanału regresji.
🔄 Identyfikacja stref odwrócenia
Jeśli cena przebije kanał regresji na niższej ramie czasowej i zbliży się do kluczowego poziomu Fibonacciego, może to sygnalizować możliwe odwrócenie. Dodatkowe oznaki odwrócenia to:
- Przeciążenie: Gdy cena osiąga lub przekracza górne/dolne pasmo, zwłaszcza gdy jest to zgodne z poziomami Fibonacciego z wielu ram czasowych.
- Divergencja z wskaźnikami momentum: Używanie tego wskaźnika wraz z RSI, MACD lub innymi może zwiększyć wykrywanie dywergencji.
- Przebicie linii centralnej: Przekroczenie centralnej linii regresji może sygnalizować zmianę dynamiki cen, szczególnie jeśli dzieje się to jednocześnie na wielu ramach czasowych.
🧩 Wielość scenariuszy
Wykorzystanie różnych kombinacji kanałów regresji i poziomów Fibonacciego na wielu ramach czasowych może tworzyć różnorodne scenariusze handlowe:
- Utrzymuj pozycję długą na 4-godzinnej ramie czasowej, jednocześnie handlując na mniejszych ramach, aby wykorzystać odbicia od poziomów Fibonacciego.
- Identyfikuj główny trend za pomocą kanału regresji 4-godzinnej i znajdź optymalne wejścia podczas cofnięć do poziomów Fibonacciego na mniejszych ramach.
- Wykorzystuj konfluencje na wielu ramach czasowych, aby potwierdzić punkty wejścia i wyjścia o wysokim prawdopodobieństwie.
📈 Strategie handlowe
Strategia odwrócenia
- Identyfikuj strefy, gdzie konwergują się poziomy Fibonacciego i pasma z różnych ram czasowych.
- Czekaj na potwierdzenie ceny (formacje świecowe, dywergencje itp.).
- Wejdź przeciwko poprzedniemu trendowi z ciasnym stop lossem.
- Ustaw cele na następnym poziomie Fibonacciego lub centralnej linii regresji.
Strategia kontynuacji
- Szukaj cofnięć do linii centralnej lub kluczowych poziomów Fibonacciego (0.382 lub 0.618).
- Potwierdź, że ogólny trend pozostaje nienaruszony na wielu ramach czasowych.
- Wejdź w kierunku trendu, gdy cena odbija się od tych poziomów.
- Ustaw stop lossy poniżej/powyżej odpowiedniego poziomu Fibonacciego.
Korzystając ze wskaźnika Fibonacci Linear Regression, traderzy mogą uzyskać głębszy wgląd w dynamikę rynku i podejmować bardziej świadome decyzje handlowe. Bądź czujny i handluj mądrze! 💻📈
Wskaźniki ze sklepu Ctrader:
Dynamic Market Structure
Analysis of Turning Points
Fibonacci Linear
Regression Multi-timeframe
Multi-Level Candle Bias
Tracker
Auto Support and
Resistance Trend Lines
Podsumowanie
Opinie klientów
5 | 100 % | |
4 | 0 % | |
3 | 0 % | |
2 | 0 % | |
1 | 0 % |


![Logo „Tabajara corrigido[fix]”](https://cdn.ctrader.com/image/webp/7f4bbef8-b245-4ebd-80d7-582fffc0c90c_28378)