
Descrição
🌟 **O que é o Z-Score?** 🌟
• **Z-Score no Trading**: É uma forma de medir o quão distante o preço atual está da sua média recente, expresso em termos de desvios padrão. 😊 Um valor próximo de 0 indica que o preço está perto da sua média, enquanto valores altos (positivos ou negativos) 😮 indicam que ele se desviou significativamente.
• **Utilidade Estatística**: Esses valores permitem identificar situações em que o preço está "sobrecomprado" 📈 ou "sobrevendido" 📉, o que pode ser útil para estratégias de reversão à média ou para detectar momentos de alta volatilidade 💥.
🌟 **Como o Indicador Funciona** 🌟
1. **Cálculo da Média e Desvio**:
- Um número específico de barras anteriores (ou períodos) é analisado para calcular o preço médio de fechamento e seu desvio padrão. 🧮
- Com esses valores, determina-se o quanto o preço atual se desvia da média. Essa diferença é expressa como um Z-Score.
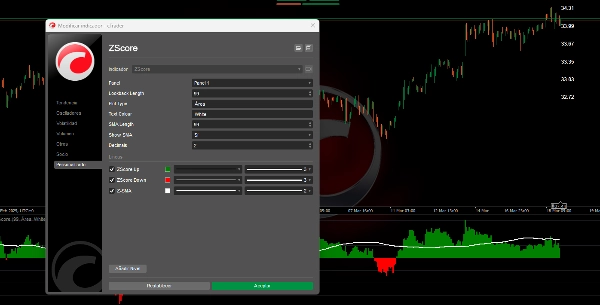
2. **Visualização do Z-Score**:
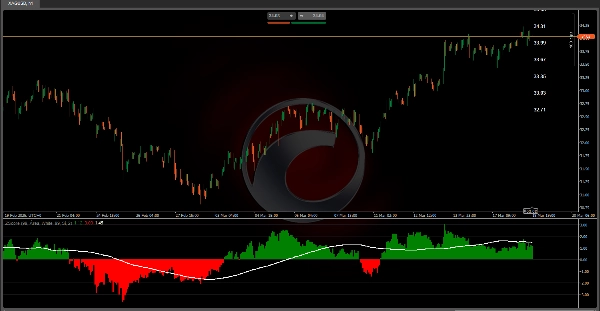
- **Modo Área**: Dois histogramas são exibidos: um em verde 🟩 para valores positivos (quando o preço está acima da média) e outro em vermelho 🔴 para valores negativos (quando está abaixo). Isso permite identificar visualmente a magnitude e a direção do desvio.
3. **Média Móvel do Z-Score**:
- Uma média móvel é calculada sobre os valores do Z-Score. Isso ajuda a suavizar as flutuações e identificar tendências em como o desvio do preço se comporta ao longo do tempo. 📊
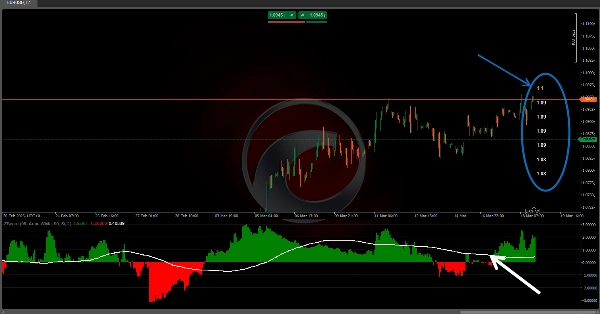
4. **Zonas de Probabilidade e Rótulos de Referência**:
- Além disso, rótulos são colocados no gráfico mostrando os preços correspondentes à média e a cada nível de desvio. Isso é útil para entender, em termos de preço, quão "extremo" o mercado está se comportando. ⚠️
---
🌟 **Interpretação e Aplicação para Traders** 🌟
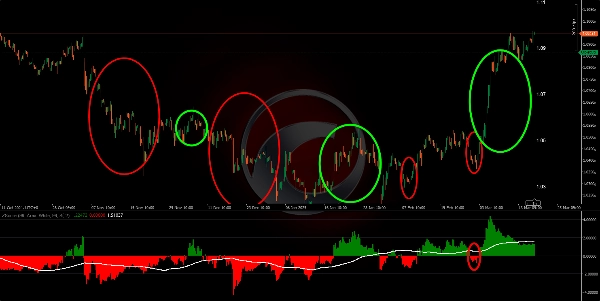
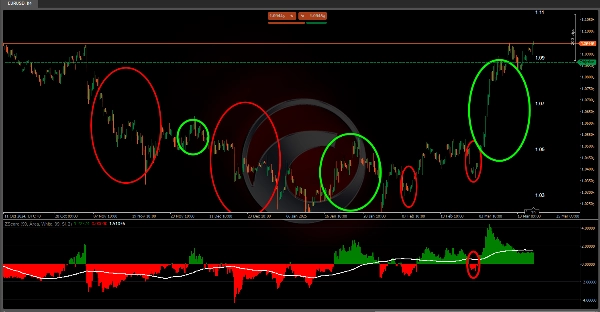
• **Detecção de Extremos**: Ao observar valores muito altos ou muito baixos no indicador, um trader pode identificar que o preço se afastou significativamente da sua média. Isso pode sugerir que uma correção é provável (se esperando reversão à média) 🔄 ou que um forte rompimento está ocorrendo.
• **Confirmação de Tendência**: A média móvel do Z-Score e as bandas associadas permitem ver mudanças na tendência do comportamento do preço em relação à sua média. Um cruzamento ou mudança nessas linhas pode ser interpretado como um sinal de entrada 🛡️ ou saída.
• **Gestão de Risco**: Ao conhecer os níveis de desvio e zonas de probabilidade, você pode ajustar tamanhos de posição ou definir pontos de stop loss ⬇️ e take profit ⬆️, pois tem uma referência para movimentos normais versus extremos.
• **Compreensão Estatística do Mercado**: Além de ser apenas uma ferramenta gráfica, este indicador incentiva a pensar sobre o comportamento do mercado em termos probabilísticos. Conhecer a "normalidade" de um movimento pode ser um fator decisivo ao avaliar oportunidades de trading. 🎯
🌟 **Conclusão** 🌟
Este algoritmo converte dados de preço em uma representação estatística que ajuda a visualizar e quantificar o desvio do preço em relação ao seu comportamento recente. Combinando o Z-Score, uma média móvel, bandas de desvio e uma tabela de probabilidade, o indicador fornece múltiplas camadas de informação. Isso o torna especialmente valioso para identificar momentos em que o mercado está em condições incomuns, facilitando decisões de entrada 🚀, saída 🛑 e gestão de risco baseadas em probabilidade e estatística. 📈📉
Indicadores da Ctrader Store:
Dynamic Market Structure
Analysis of Turning Points
Fibonacci Linear
Regression Multi-timeframe
Multi-Level Candle Bias
Tracker
Auto Support and
Resistance Trend Lines
Resumo
Avaliações de clientes
5 | 100 % | |
4 | 0 % | |
3 | 0 % | |
2 | 0 % | |
1 | 0 % |


